ARM64 Boot Camp
(c) 2024 by Darek Mihocka, founder, Emulators.com.
updated January 16 2024
Installing Windows on
ARM developer tools
This is one of the most frequently asked questions I get from
developers curious about ARM64, and that is what tools to use and
where to find them. Let's say you're ready to build your first Windows hello world
for ARM64. Where to begin?
The TL;DR short answer today in 2024 is - it is the exact same tools you're already using to build and debug Windows applications on your AMD and Intel machine! Building for ARM64 does not require some weird one-off toolset like used to be the case for Windows CE, Windows Phone, or Windows RT. Those days are gone. ARM64 is a first-class citizen in Windows 11.
The other good news is all the compiler and debugging tools are freely available from Microsoft these days. Unlike the early 1990's where Visual C came in a boxed package weighing many kilograms, today all the tools can be downloaded and installed electronically.
In this tutorial I will show you how to take a bare Windows installation and turn it into a full Windows on ARM development machine by installing these 4 sets of tools:
And I will also show you how to just set up the debugger and tracing tools when setting up a test machine where you are only debugging and troubleshooting but not compiling code:
As of mid-2023, native ARM64-hosted versions of Visual Studio, the Windows Debugger, and TTD were all available and free to download. When you install these tools today you get both the AMD/Intel support and the ARM32/ARM64 support. This is very different from the initial days in 2018 when all the tools were 32-bit x86 and had to run under x86 emulation on ARM64 devices, and you couldn't debug x64 and all that nonsense. One thing you will realize as you follow my directions below: the steps for installing and running these tools on an ARM64 machine are virtually identical to setting them up on plain Intel Core i7 or AMD Ryzen machine.
A very cool thing about existing Snapdragon based devices such as the Surface Pro X, Lenovo x13s, Volterra, and Samsung Galaxybook2 Pro 360 is that they are able to run and debug binaries of 4 CPU architectures on the same device. That's because Windows 11 on ARM supports running x86 binaries emulated using xtajit and Wow64, x64 binaries emulated using xtajit64 and ARM64EC, ARM32/Thumb2 binaries run under Wow64, and ARM64 binaries running natively. This is why I've really enjoyed developing on my Volterra and other ARM64 devices, because I can not only build 5 different versions of say Xformer 10 (x86, x64, Thumb2, ARM64, and ARM64EC) but I can also test and debug them on the same hardware. No AMD or Intel desktop required like in the old days of cross-compilation.
First, Visual Studio 2022 (which as of this morning is version 17.8.4). Microsoft makes available a free "Community Edition" which is free to use and runs on any Windows 11 on AMD, Intel, or ARM64 device or recent 64-bit Windows 10. Regardless of your physical host processor (AMD x64, Intel x64, Apple Silicon ARM64, or Snapdragon ARM64) you can target builds to generate binaries for all architectures using a single installation of Visual Studio.
Older versions of Visual Studio such as 2017 and 2019 and the first few 2022 offered 4 target architectures mentioned above: 32-bit x86, 64-bit x64, 32-bit ARM32 (really Thumb2), and 64-bit ARM64.
Visual Studio 2022 17.4 released last year officially began to support ARM64EC - the hybrid x64/ARM64 "emulation compatible" model. This is not a new CPU architecture, but rather a new binary format (called ARM64X) which allows mixing of x64 code with ARM64 code in the same binary. I will post a separate tutorial dedicated to ARM64EC/ARM64X, but effectively there are 5 architectures that you can target and build for today.
ARM32/Thumb2 is being deprecated and no longer supported in future Windows releases. Future ARM64 processors (and Apple Silicon today) will not support Thumb2 or ARM32 instructions in hardware. That means that going forward the 4 architectures you will care to target are: x86, x64, ARM64, ARM64EC.
Your starting point for installing Visual Studio is, not surprisingly: https://visualstudio.microsoft.com/
Click on the "Download" link which takes you to this page: https://visualstudio.microsoft.com/downloads/
You should see this Community Edition download link:

Click on that "Free download" button and you should receive a download of VisualStudioSetup.exe. Run it and click through until you get to this screen:
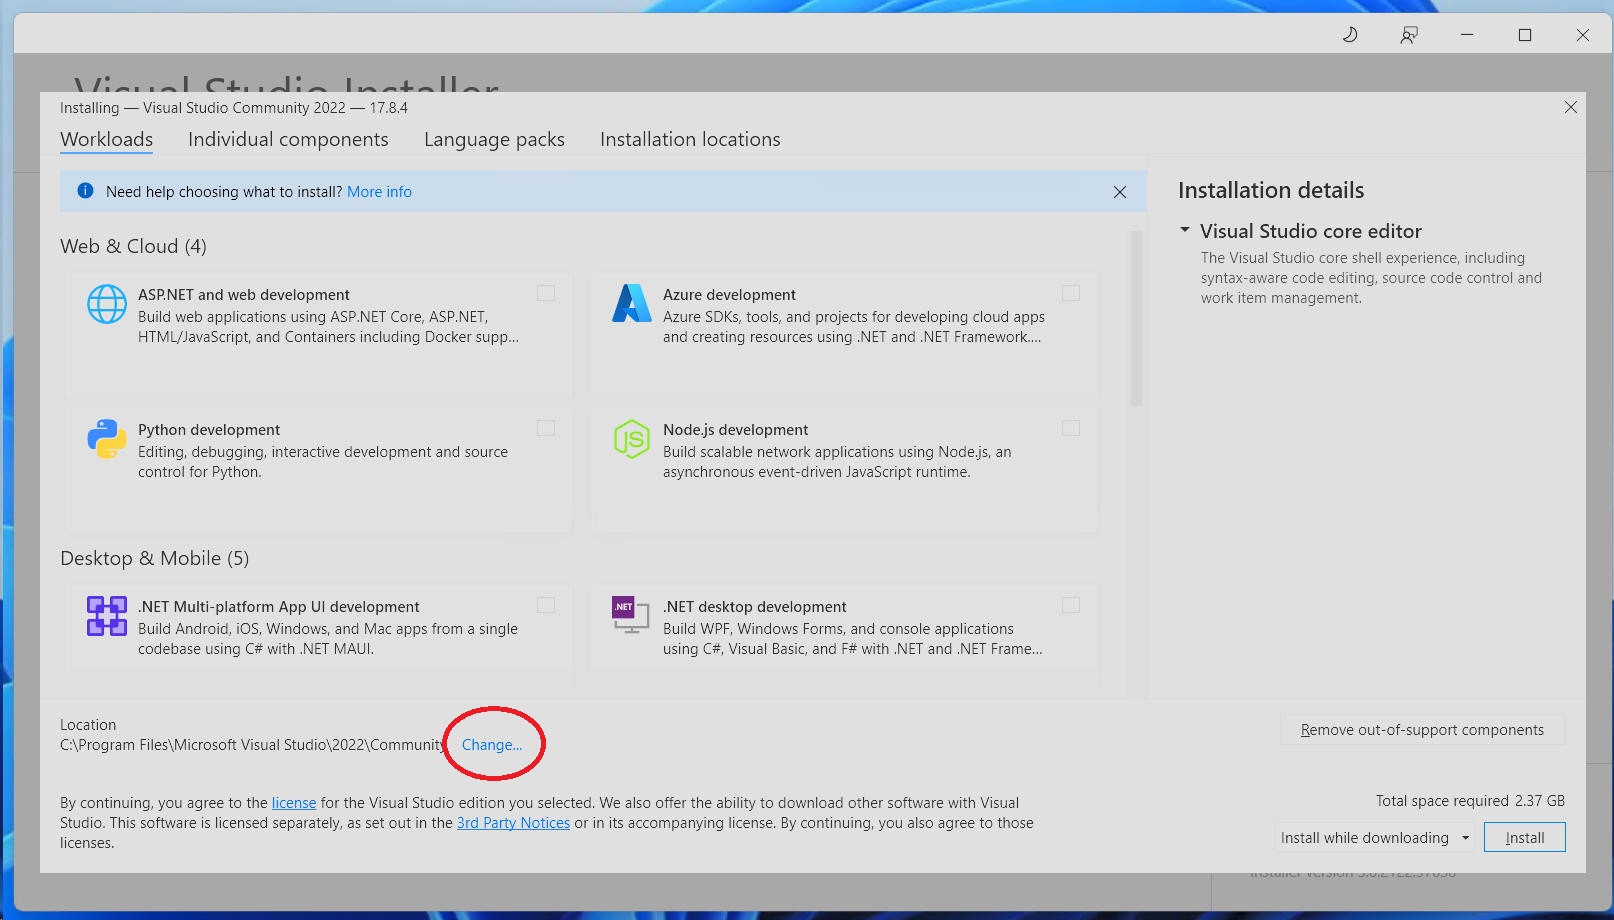
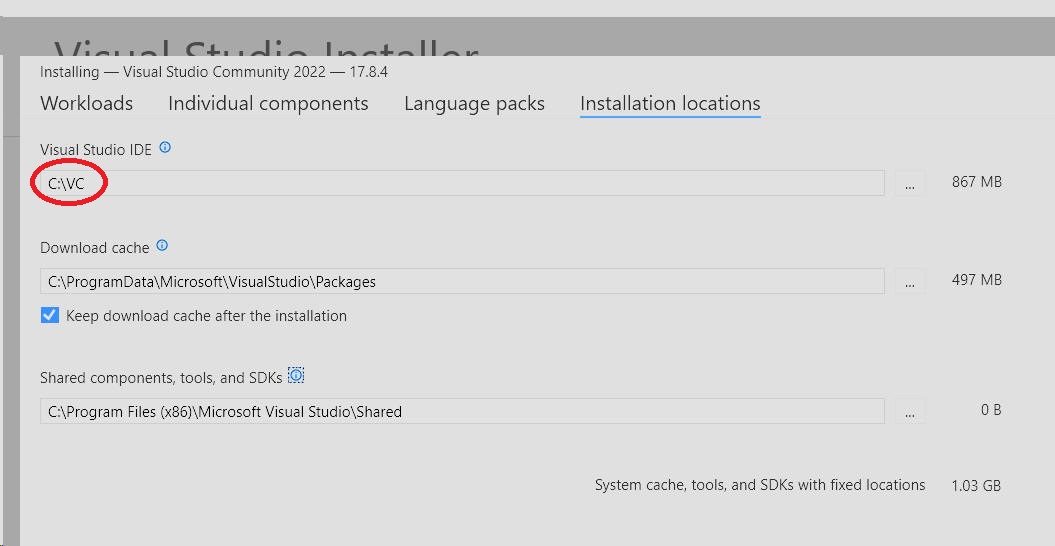
I personally dislike long installation paths, so the first thing I do is click "Change..." and modify the installation path to something short like: C:\VC
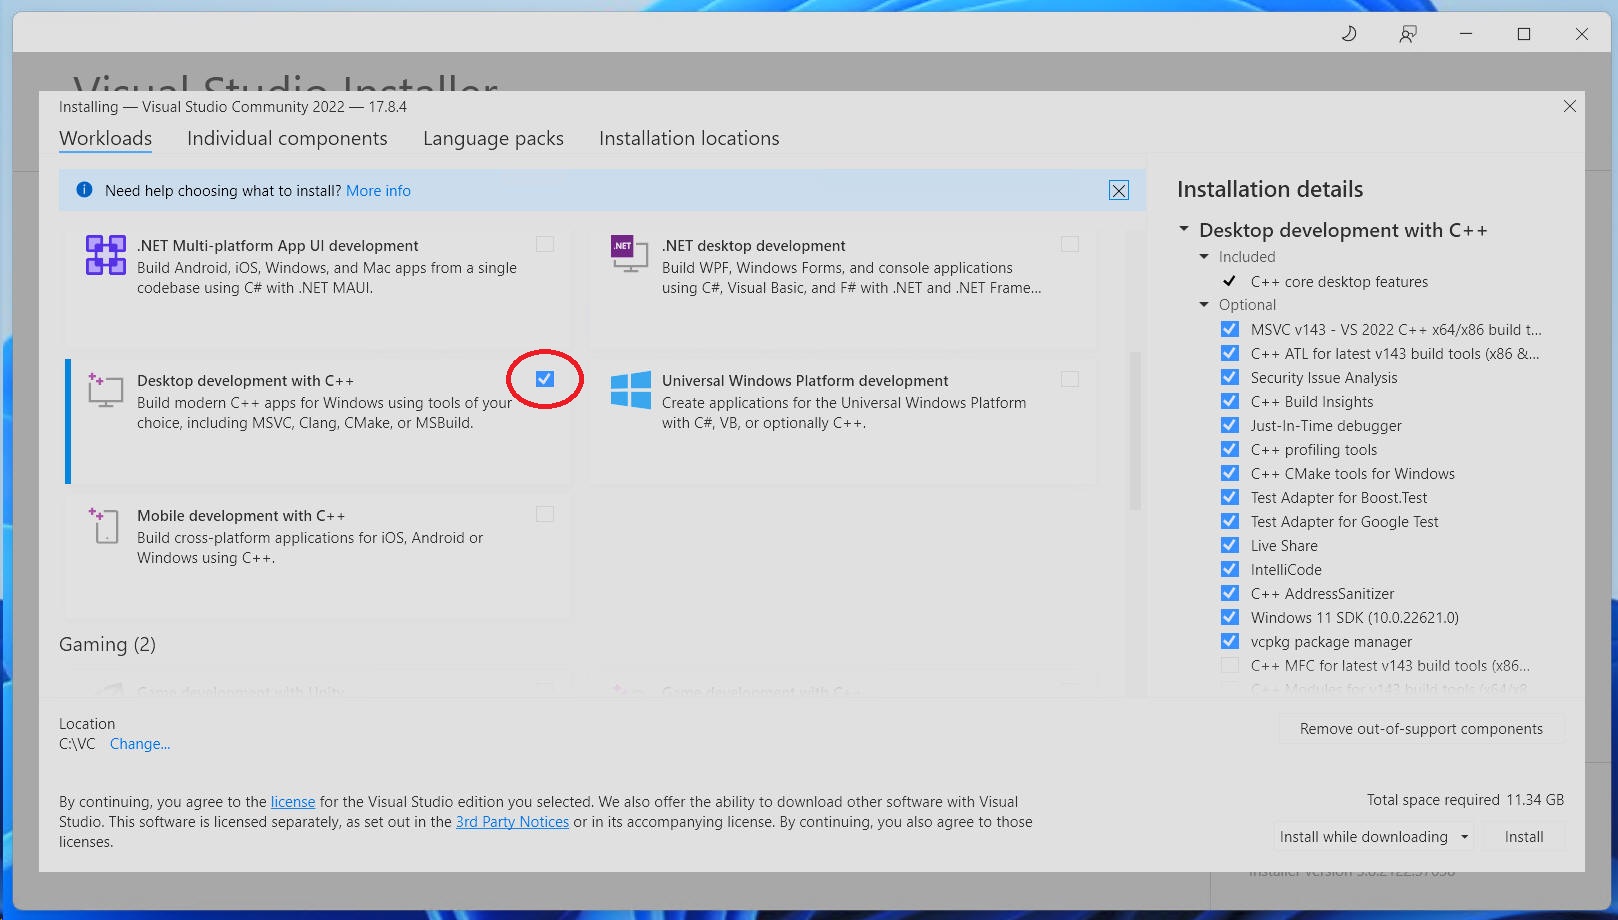
Next, click on the "Workloads" tab. Since I am over age 50 and therefore only develop native applications in C and C++ and assembly code, I only select the "Desktop development with C++" workload. If you are under age 50 then go ahead select whichever workloads meet your API-of-the-week needs ha ha, whether .NET, UWP, etc.
Now let's customize. Click on the "Individual components" tab and type in "ARM64EC". If it is not selected, make sure that the "ARM64/ARM64EC build tools (Latest)" option is selected:
Next, if I setting up a new machine, I like to make sure Git source control is available, so type "git" into the filter box and select the "Git for Windows" option:
Finally, type in "SDK" and scroll down to the bottom and make sure that at least "SDK 10.0.22621.0" is selected. Optionally, because we'll be doing some spelunking through the older SDK releases in a future tutorial, I also select the 19041 (which corresponds to Windows 10 20H1 "Vibranium") and 22000 (Windows 11 21H2 "SV1/Cobalt"):
Now, before I click "Install" I like to manually delete a few options I don't care about such as ATL, so scroll through the individual components on the right side of the screen and de-select those I don't care for. This is entirely optional to you depending on whether you need these extra components, but I would minimally recommend unselecting "Just-in-Time debugger". I cannot stand Visual Studio's built-in debugger, it is and always has been complete garbage compared to the separate Windows Debugger, but it's your preference so do or do not:
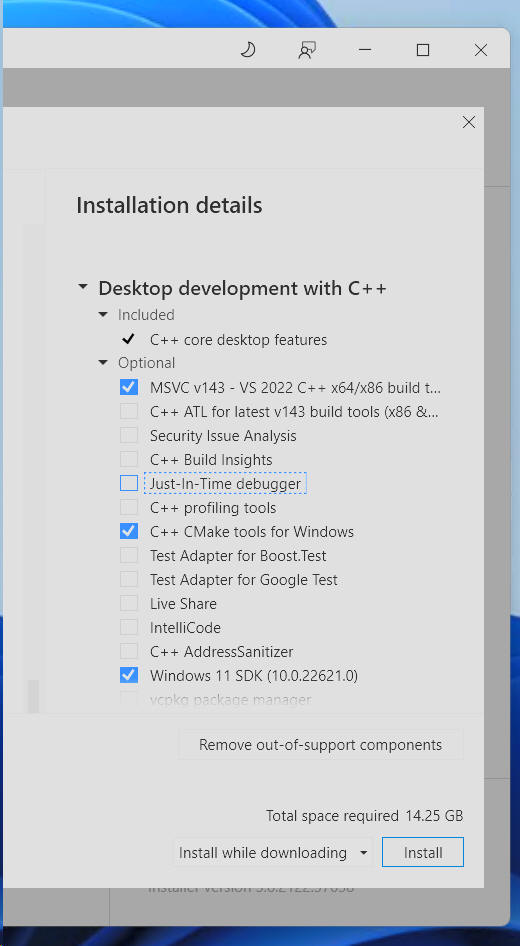
Now finally click "Install" and go make yourself another coffee while everything installs:
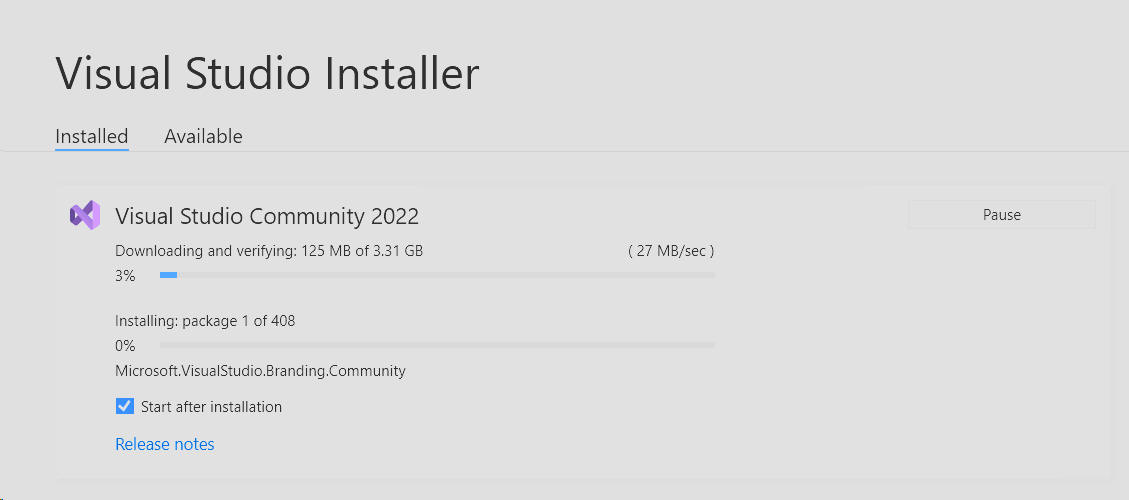
After about 10 minutes you should see this:
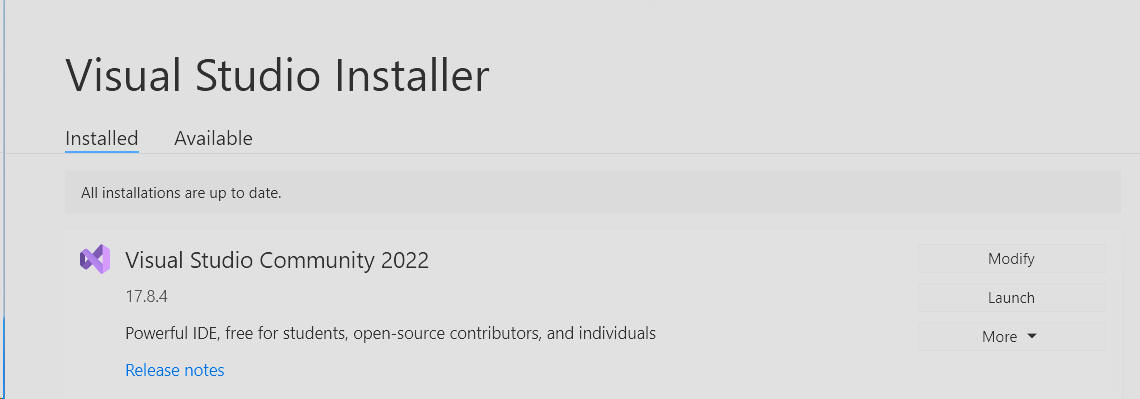
At this point you can click "Launch" and go through the first-time configuration of Visual Studio. Because this is a Community Edition there is no need register or license, you can click the "Skip for now" button at the login.
Accessing Visual Studio Command Line Tools
Being over 50 I'm not a fan of GUI development environments. I still build my projects from the Windows command line using CL.EXE compiler driver (i.e. "cl hello.c") which is a workflow that dates back to the old 16-bit Microsoft C compiler from MS-DOS days. This is also no different than typing "gcc hello.c" or "clang hello.c" on Linux or macOS.
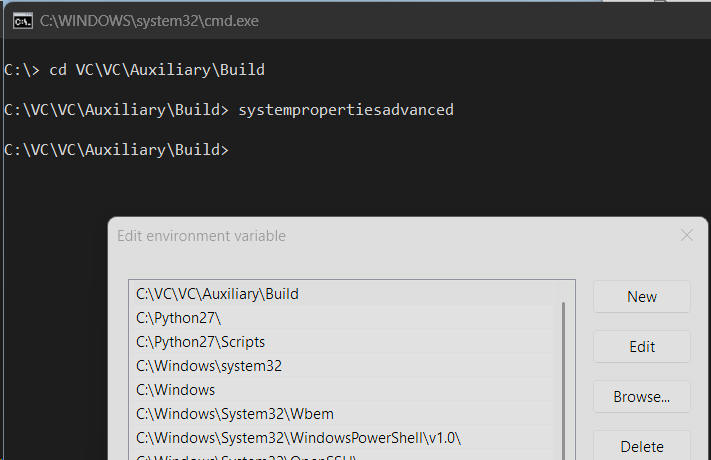
So the first thing I do after Visual Studio in installed is to open up a CMD.EXE command line prompt. If you followed my directions to use C:\VC as your installation path you can navigate to this directory - C:\VC\VC\Auxiliary\Build - and then type "SystemPropertiesAdvanced" as shown below. Click "Environment Variables" then select the "PATH" variable, click "Edit" then add the same C:\VC\VC\Auxiliary\Build path to the variables.
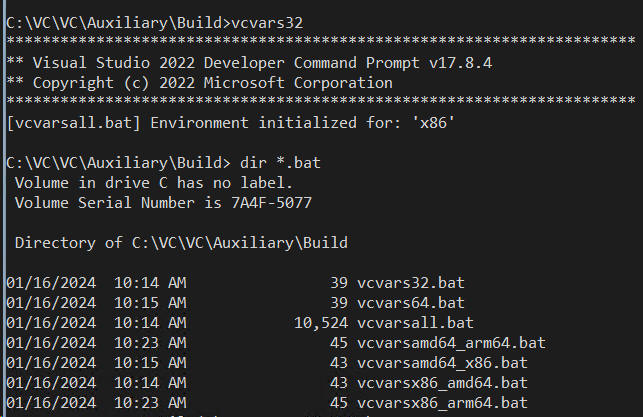
Click "OK" three times, close the original CMD window, and open a fresh CMD window. You should now be able to type in "vcvars32" and what you will get is a 32-bit x86 build environment. Use "vcvars64" for a 64-bit x64 build environment. In fact, there a number of scripts to create various build environments, and depending on whether you are on an AMD/Intel-hosted machine or an ARM64-hosted machine, you will see slightly different results.
on an AMD/Intel machine:
on a Snapdragon or Apple Silicon ARM64 machine (Pro tip: use /b switch with DIR to just list filenames):
Notice that the ARM64 install has additional scripts for setting up the environment. That's because Visual Studio provides compiler tools which can be hosted on x86, x64, and ARM64, and each of those can then target the other architectures. So for example, vcvarsx86_arm64.bat creates a build environment which uses a 32-bit x86 hosted compiler which targets ARM64 binaries - meaning it is a cross-compiler, and which will run under emulation on an ARM64 device.
In other words, the scripts which only list one architecture in the name: vcvars32.bat, vcvars64.bat, and vcvarsarm64.bat - host on the same architecture that they target; they are not cross-compilers. Use one of them to build and run on the same machine that you are using, or to cross-compile to the other two architectures when you're hosting on an ARM64 machines. Those are the three scripts I use the most to set up my build environments on the Volterra, even thought that means I am running the x86 and x64 compilers in emulation.
What I should more correctly be doing is specifying all of the native toolsets for my host device. So for when I'm building on my Volterra or other ARM64 host I should be using: vcvarsarm64_x86.bat, vcvarsarm64_amd64.bat, and vcvarsarm64.bat to avoid any emulation during builds. Similarly, on an AMD or Intel machine where ideally I want to run the 64-bit hosted compiler tools, I should be using: vcvarsamd64_x86.bat, vcvars64.bat, and vcvarsamd64_arm64.bat.
Targeting ARM64EC
ARM64EC is not a new instruction set architecture. It is a hybrid x64/ARM64 calling convention and binary layout. So it is built using the same tools as native ARM64, except you add one additional -arm64EC command line argument:
cl hello.c <== this is pure native ARM64 target
cl -arm64EC hello.c <== this generates a hybrid ARM64EC target
Again, I'll cover ARM64EC in a separate tutorial.
The Windows SDK is the Software Development Kit needed to build applications for WIN32, .NET, and other Windows-specific APIs. The SDK provides header files and libraries that are in addition to the standard C and C++ headers and libraries which come included with any compiler toolset: stdio.h or string.h come from the compiler, but windows.h comes from the SDK.
Visual Studio's setup permits you to only install Windows SDK releases which correspond to officially released and supported Windows releases such as Windows 10 20H1 (19041), Windows 11 "SV1" 21H2 (22000), or Windows 11 "SV2" 22H2 (22621). In other words, the SDKs which Visual Studio provides are frozen in time.
Microsoft does provide this page: https://developer.microsoft.com/en-us/windows/downloads/windows-sdk/ which offers the latest servicing release of the most recent official SDK. So today for example, the page is serving up the 22621.2428 SDK update, which contains minor fixes from the original 22621 release from 2022.
But what if you are targeting new hardware or new APIs or new features which are coming soon but not supported in that previous "official" Windows release? You then need to go and download a Windows Insider Preview SDK from this page: https://www.microsoft.com/en-us/software-download/windowsinsiderpreviewSDK
The preview SDK corresponds to the latest Windows Insider Preview build of Windows, and both are typically updated weekly every Wednesday afternoon (sometimes every other Wednesday). Pro tip: I make it a point to download both a new Windows Insider build _and_ the corresponding new SDK build at least once a month. Besides the obvious motivation to have libraries and documentation for any new APIs, this also ensures that when I build and link an application I am doing so against the most current headers and LIBs as they may contain compiled code optimizations and security fixes.
Once you log in to that page with your Insider credentials, scroll down to "Select edition" and select the latest Canary build, which at the time of this writing is build 26020:
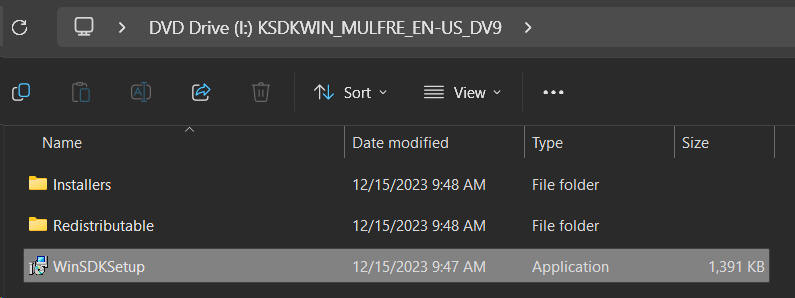
This will download an .ISO disk image. Open the image and run WinSDKSetup.exe as shown:
Click through "Next" twice, then click "Accept", and you should see this dialog:
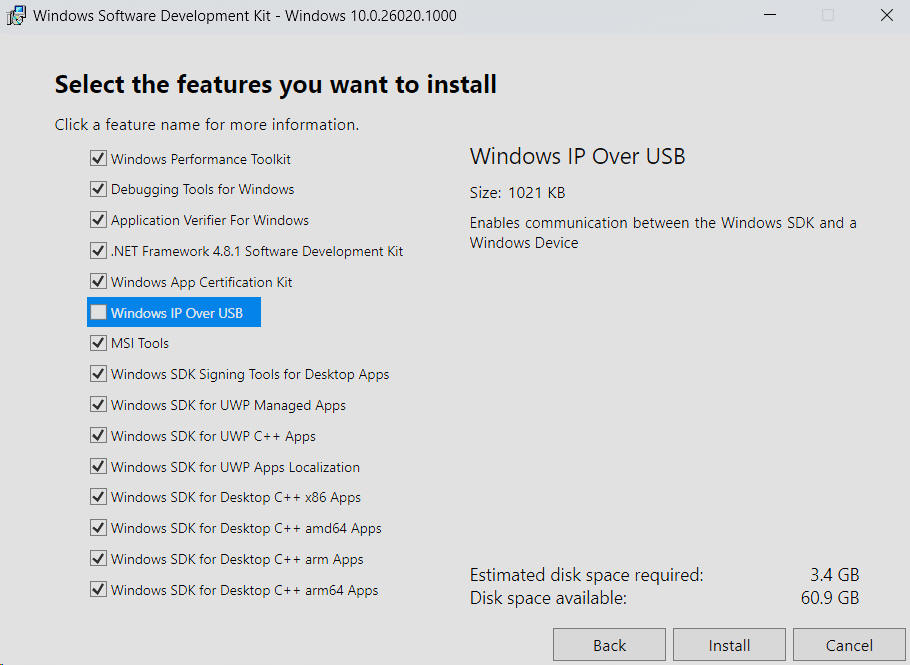
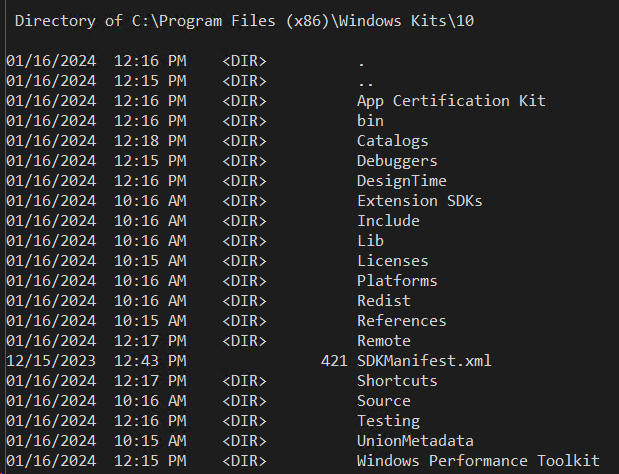
For local debugging on the same device, you don't need the USB support, so un-select "Windows IP Over USB". Now click "Install" and go make another coffee. All of the Windows SDKs (Windows 10, Windows 11, official and preview) end up under the directory tree C:\Program Files (x86)\Windows Kits\10:
When you now open up a new Visual Studio development environment, the latest installed SDK will automatically be used. You can verify this by searching through environment variables with "WindowsSDK" in them:
In this case 26020 is the latest SDK being used for builds. If you have multiple SDKs installed you can change these environment variables to the version you'd prefer to build against.
Installing the "classic" Windows Debugger
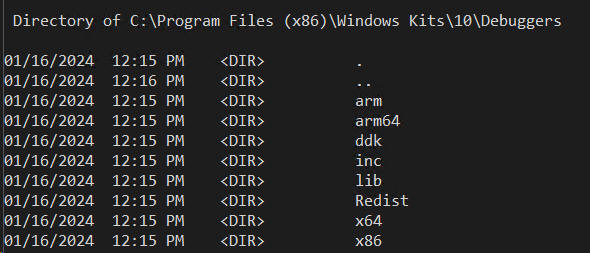
If you then further navigate into the SDK's Debuggers directory, you will see architecture-specific subdirectories x86, x64, arm, and arm64:
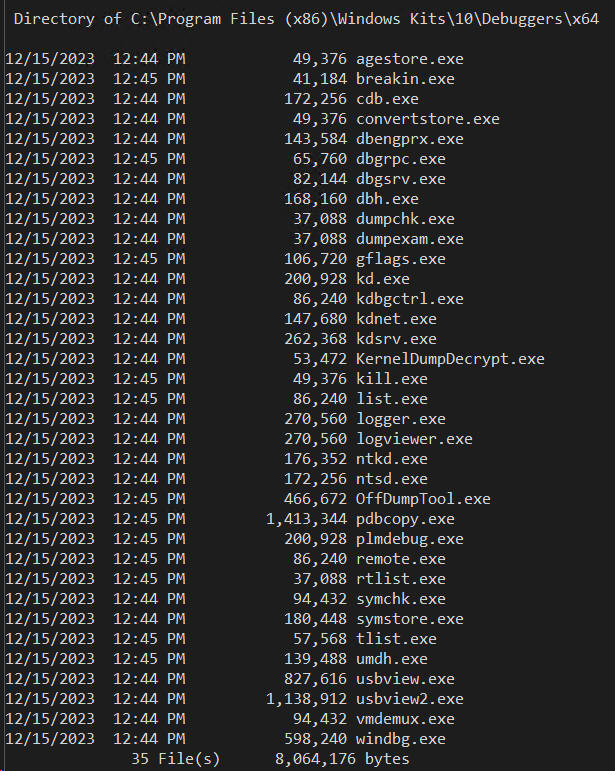
Each contains a native build of the debugger binaries for that particular architecture. So for example, on my AMD Ryzen machine, if I navigate to the x64 directory I see these native x64 executables:
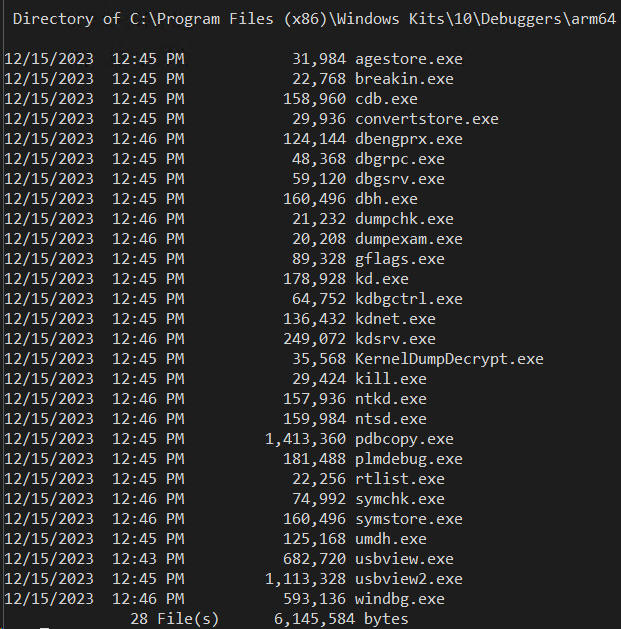
whereas if I navigate to the arm64 directory, I see these very similar executables (except they are native ARM64 binaries):
Select the appropriate directory (x64 or arm64) corresponding to the native CPU architecture of the machine you are debugging on, and add it to your PATH variable in the same way I showed you above to add the compiler scripts.
Pro Tip: I prefer having all my tools in a fixed canonical location off the root of the C: drive, so what I do is I XCOPY the appropriate debugger directory tree above to C:\Debuggers and use that directory in the PATH variable instead.
Notice there are multiple variants of the debugger in each directory such as kd.exe the kernel debugger. There are two user-mode debuggers I frequently use: cdb.exe and windbg.exe. "cdb" stands for "Command-line Debugger". "windbg" obviously stands for "Windows Debugger". They are actually one and the same debugger under the hood except for the different user interfaces - text or GUI. There are advantages to using the text-based command line debugger which I will demo in a future tutorial.
Note that what is installed by the SDK are considered the "classic" debuggers whose user interface dates back to the 1990's and Windows 95 days. Later on below I will show you an alternative method of installing an newer debugger interface which is designed for Windows 11.
Installing TTD (Time Travel Debugging)
Now we get to my favorite debugging tool - TTD, or "Time Travel Debugging". TTD is Microsoft's reverse execution debugging tool, which allows you to capture complete execution traces of a user-mode application and then "replay" that application afterwards in a debugger, even on a different computer. A TTD trace is not unlike a traditional crash dump, except a crash dump is a single static snapshot of a process, while a TTD trace is a dynamic snapshot of a running process from launch to exit.
I originally helped prototype and develop the proof-of-concept of TTD back when I worked in Microsoft Research over 20 years ago, and have contributed to its development over the years since. I am excited that after many years of TTD being an internal-only tool at Microsoft, the full public command line toolset for TTD was released to the general public in 2023.
I will do a separate tutorial on how to actually use TTD and all the cool things it can do. Today I will show you how to just install the tools.
Little known fact: a version of the TTD trace recorder tool has actually been built-in to Windows 10 and Windows 11 for years but was not publically documented. On any AMD or Intel based PC running Windows 11 for example, look inside the C:\Windows tree and you will find both the 64-bit and 32-bit tracers right there pre-installed and ready to use:
Pro Tip: If you ever find yourself trying to debug an application on a machine you don't easily have access to (e.g. a friend's machine, a customer's machine, etc.) or don't wish to taint it by installing additional tools, simple use that built-in tttracer.exe to capture a trace of the application then move the resulting trace file over to a USB drive or directly to your own computer for the actual time travel debugging.
On your own developer machine or test machine, you will want to install the very latest official TTD tools. Open up a browser and navigate to https://aka.ms/ttd which will give a brief introduction to what TTD where you can find this link to the TTD Command Line Tools page which will then lead you to the TTD download link: https://aka.ms/ttd/download
Go ahead and install. No icon or app will appear in your Start menu - there is no "TTD app" to launch. Rather, what happens is that a zero-length stub ttd.exe is installed and automatically appended to your PATH environment variable:

That's it, that is all the installation required. The newer ttd.exe is a replacement for (and supersedes) the tttracer.exe which was built-in to Windows. The 0-byte ttd.exe stub actually points at this directory containing the true TTD.exe command line launcher, injector, loader, and tracer:
To actually time travel debug a trace you will need a debugger and the TTD replay engine, which both come bundled together as I am about to describe next...
Installing the standalone Windows Debugger + TTD
I showed you above how to install the "classic" Windows Debugger via the Windows SDK route. Now I will show you simpler installation method. This will install a newer GUI version of the debugger which is designed to look more like a modern Windows 11 app. Functionally all three variants of the debugger (command line, "classic" WinDbg, "new" WinDbg) are about the same - it's just a matter of which user interface you prefer.
So let me show you first WHAT NOT TO DO! Do NOT open the Microsoft Store from the Start menu, do NOT type "windbg" or "Windows Debugger" into the search bar. Do NOT install "WinDbg Preview":
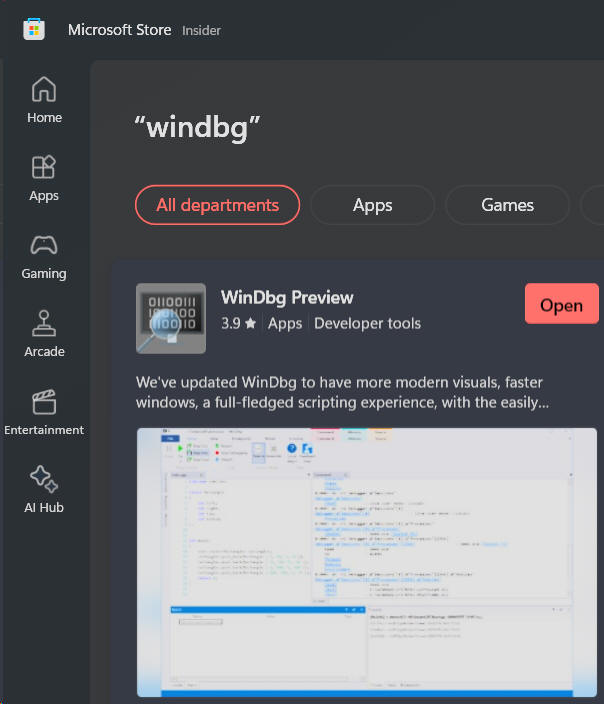
Yes, although this "new" debugger has been available for a while, Microsoft still brands the store version as a "Preview" and so I question how up-to-date those bits are.
There is a more direct distribution channel for the "new" debugger. Go into your browser and type "aka.ms/windbg" which will take you to this page:
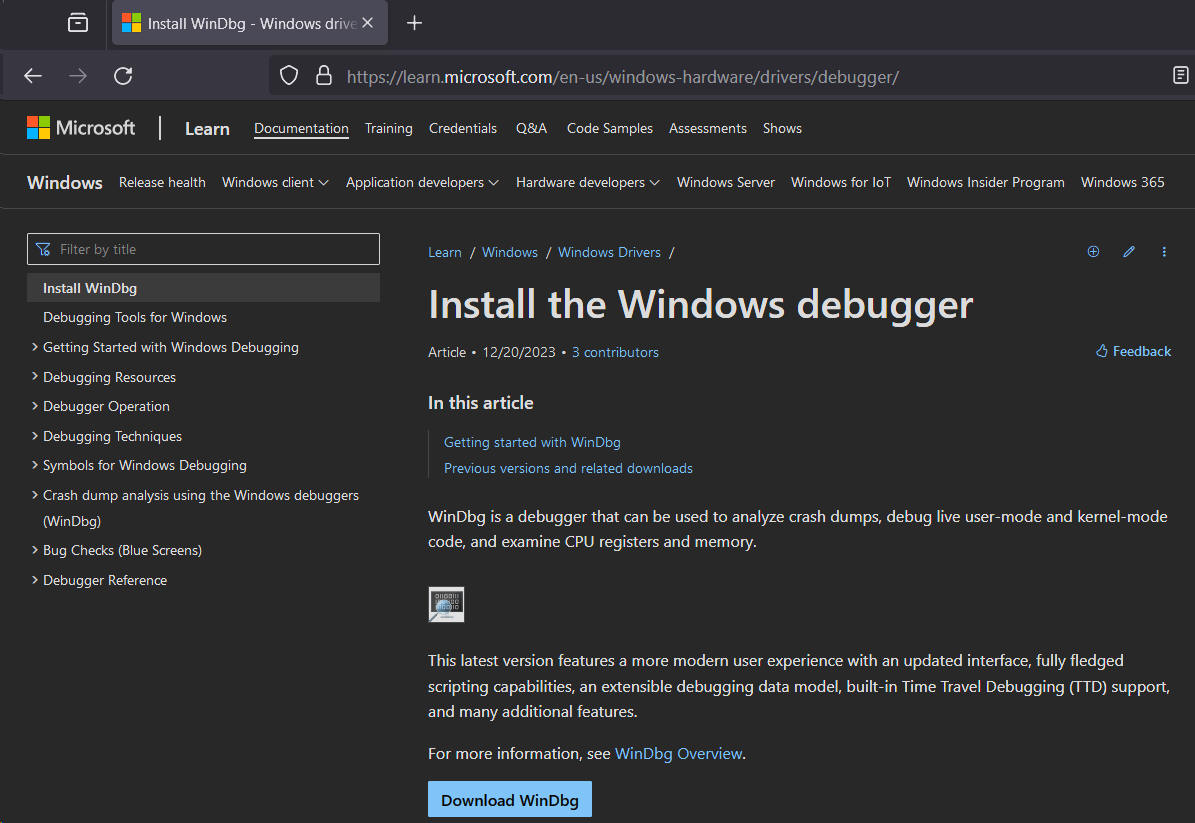
Now click the "Download WinDbg" button (which currently resolves to "aka.ms/windbg/download") and this will guarantee that you are installing the most recent new WinDbg release - which as of today is WinDbg 1.2308.2002.0:
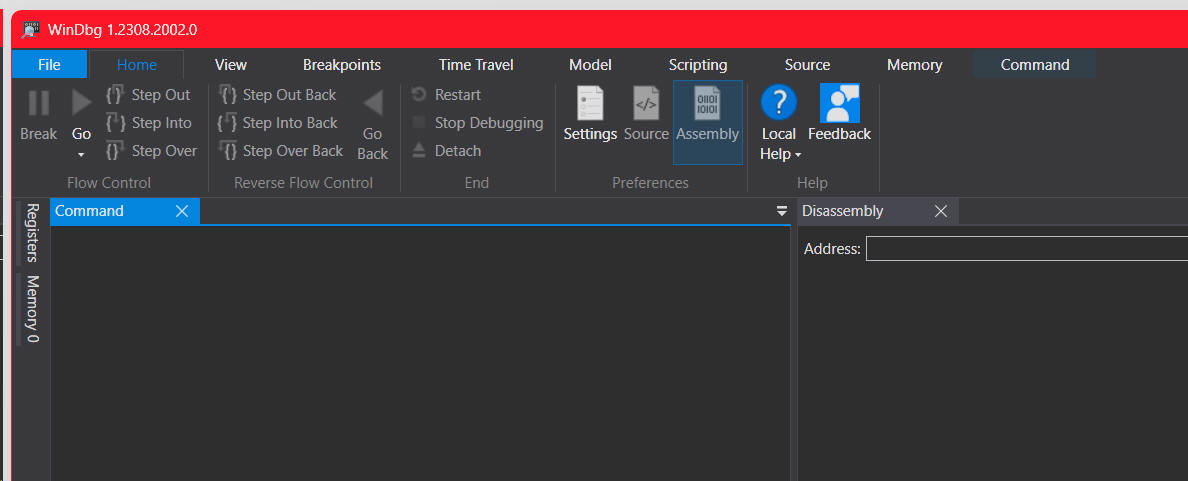
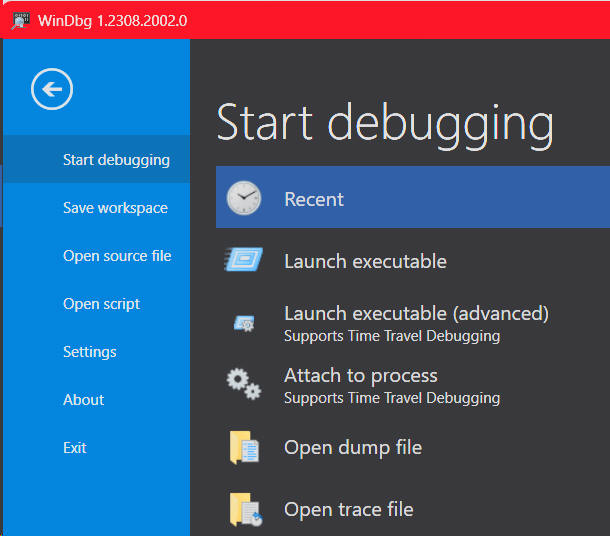
Notice that as you launch this debugger and click the "File" menu, Time Travel Debugging is also installed - including support for debugging a time travel trace file:
Pro Tip: Using this method of installation can be useful when you merely want to set up a debugger on a machine (for live debugging and/or time travel debugging) and do not necessarily require the full Visual Studio or SDK build environment.
[ARM64 Boot Camp: Table Of Contents] [Return to Emulators.com]