ARM64 Boot Camp
(c) 2024 by Darek Mihocka, founder, Emulators.com.
updated January 28 2024
Understanding x86/x64 Emulation
on Windows on ARM
This final tutorial on the mechanics of emulating x86 and x64 code on
ARM64 continues from where my previous
ARM64EC Explained tutorial
left off. That tutorial introduced you to the concept of
fast-forward sequences,
entry thunks, and the
EC Bitmap which all work together to transition emulated code to
natively compiled ARM64EC code. Now I'll complete the loop by
explaining how to go the other direction at runtime - which involves
"exit thunks" and jumping back into emulation - as well as
how to probe the properties of the emulation and even look at the
translated code sequences.
Nerd alert! Numerous sample source code examples are given in this tutorial to demonstrate how code behaves differently under emulation than on native hardware, how code can detect that it is running under emulation, how to probe the capabilities of the emulation in Windows, and how to tweak the behavior of that emulation. I will even demonstrate hybrid JIT - the ability to dynamically generate and run both Intel and ARM64 code in the same process at the same time. As one of the engineers at Microsoft who helped develop not one but four different emulators that ship in-box as part of Windows 11 today (TTD, xtajit, xtajit64, and xtabase), I will give you as many tips and suggestions to guide you in understanding emulation; and perhaps even inspire you to develop your own emulator for Windows on ARM! There is no reason the efforts already taking place on Linux with QEMU and FEX can't be adapted to run on Windows PCs.
A quick peek at today's subtopics:
How an emulated process launches
TL;DR
In short, these are ten quick facts you need to know about x86/x64 emulation on Windows on ARM:
- - 32-bit Intel x86 emulation and 64-bit Intel x64 (a.k.a AMD64) emulation use two complete different mechanisms and are effective two different emulation implementations. I will mainly focus on 64-bit emulation in this tutorial and only touch briefly on 32-bit emulation to contrast the differences.
- - 64-bit x64 emulation is implemented by four different modes of execution - a pure interpretation mode, a purely just-in-time (JIT) dynamic translation mode, a post-JIT cached translation mode, and an ahead of time pre-compiled native mode which you already know as ARM64EC. Multiple modes can and usually do interact as an emulated application (or emulation compatible application) is running (e.g. interpreter + ARM64EC, or JIT + AOT). The four modes range in order from slowest (interpreted mode is about 5% to 10% of native but most faithful to x64 accuracy) to faster (JIT and cached which drop some floating point accuracy) to fastest (ARM64EC, which is almost as fast as classic native ARM64 with some by-design performance speed bumps to be emulation compatible).
- - Most of the heavy lifting of the emulation is actually handled by the Windows kernel and OS system DLLs such as NTDLL, along with clever compiler and linker code generation (such as the "exit thunks" I will discuss shortly). What most people think of as "the emulator" (the various XTA*.DLL and .EXE files) are merely the x86/x64-To-ARM code translation binaries; and these are pluggable components. Any clever third party could develop an alternate translator without needing to make any changes to the existing emulation plumbing wired in to Windows. A third-party translator would be a very cool and useful thing to develop (and is easier than you think!)
- - The four modes of execution can be (and have been) used to double check each other's correctness - a concept known as co-simulation. This technique can also be used to bootstrap and check the correctness of any new alternate translator. Thanks to the EC Bitmap, Windows 11 on ARM supports hybrid JIT allowing for dynamic code generation of _both_ Intel code and ARM code on-the-fly. I will demonstrate how this is a first step to implementing a new emulator.
- - Different releases of Windows on ARM emulate slightly different processors and CPU capabilities. In 2018, Windows 10 on ARM only provided 32-bit x86 emulation supporting Intel SSE4.1. By 2022, Windows 11 had added 64-bit x64 emulation, with support for Intel SSE 4.2. The emulation capabilities are _not_ a function of the ARM64 hardware that you are hosting on. Rather, it is a function of the specific Windows release.
- - Emulation can be improved with software updates. Since the last official release of Windows 11 SV2 22H2 fewer than 18 months ago, emulation performance has measurably increased on same hardware in newer Windows Insider builds when compared to 22H2 on the same hardware. It is absolutely worth upgrading to the latest Windows Insider on ARM releases. And I look forward a new official Windows on ARM release hopefully this year so that everybody can receive the upgrade. (Windows 11 23H3 released a few months was a service pack, not the full upgrade I was expecting).
- - There are really two classes of ARM64 CPUs out in the Windows market today you should care about. There is the first batch of Snapdragon 835, 850, and first generation 8cx processors released in 2018 and 2019 which are effectively cell phone CPUs put in a Windows laptop. These as nice "proof of concept" processors which showed that Windows on ARM was a viable platform. The second class of ARM64 processors started rolling out in late 2020 with the Apple M1, followed by two great processors released in 2022 and 2023 - the Apple M2 Pro, and the Snapdragon 8cx 3rd generation (a.k.a. Snapdragon 8280). The best analogy of these two classes of ARM64 CPUs is like comparing the 2008-era "little core" netbook CPUs vs. "big core" CPUs such as when I compared Intel Atom to the Intel Core i7 back in 2008. If your shopping for an ARM64 laptop today only consider those based on Apple Silicon or the Snapdragon 8cx 3rd gen 8280. Period.
- - No support exists for AVX or AVX2 emulation. AVX is a common AMD and Intel instruction set extension released in 2011 present in over 90% of Windows PCs in use today (and is practically required for Windows 11). This places the emulation capability back to where AMD and Intel processors were almost 15 years ago in the Windows 7 days! If Microsoft does not implement AVX and AVX2 support soon to keep with AMD and Intel, the emulation - and Windows on ARM - will become stale and irrelevant. AVX2 support was my #1 ask to work on when I still worked at Microsoft, and it is the thing I still nag them about today.
- - Virtual machine emulators such as Parallels, VMware Fusion, and UTM are easy ways to install Windows on a new Apple Macbook - I use all three of these VMs. It is easy to compare the performance on Apple's Rosetta 2 against Microsoft's emulators, and you might be surprised that Rosetta and Microsoft XTA are not that different. Both emulate SSE4.2 and both achieve about 50% of native ARM64 performance.
- - There is plenty of opportunity for further performance optimizations. I will demonstrate in this tutorial how to discover and view the in-memory translation cache and point out some obvious opportunities. Outside of the scope of this tutorial there are also simple hardware optimizations that both Apple and Qualcomm miss which AMD and Intel have already implement (for example, the store-forwarding elimination I mentioned last year).
Emulation is very friendly with the Windows Debugger and third-party profiling tools such as Superluminal, so assuming you followed my tutorial on installing developer tools for ARM64, you should be able to follow along with my coding examples below and build them yourself as we go spelunking deep into the rabbit hole of code translation.
Let's start with very simple program that forces a C function to call to some x64 assembly code. This will guarantee that the 64-bit emulation gets invoked since the assembly code will get built as Intel bytecode not as ARM. I will use the Intel CPUID instruction as that assembly code because CPUID is an incredibly fascinating instruction from the point of view of Intel emulation and this will give me an opportunity to take you the reader down a very deep rabbit hole.
First let's build this on my AMD 5950X box and pure native x64 code. We need a small ASM stub function to invoke CPUID instruction. Then a small C function to call that ASM and print the result. Here are my two source files, one ASM file and one C file:
; ; CPUID64.ASM ; ; 64-bit test code for CPUID ; ; 2024-01-24 darekm ; .RADIX 16t OPTION SCOPED OPTION CASEMAP:NOTPUBLIC .CODE CallCpuid PROC mov eax, ecx mov ecx, edx cpuid ret CallCpuid ENDP END // // CPUIDMAX.C // // Call CPUID and display the highest CPUID function supported. // // 2024-01-24 darekm // #include <stdint.h> #include <stdio.h> extern uint32_t CallCpuid(uint32_t EAX, uint32_t ECX); int main() { uint32_t Max = CallCpuid(0, 0); printf("CPUID function 0 returned max functions = %u\n", Max); return Max; }
So now lets open a vcvars64 Visual Studio developer prompt for x64, assemble the ASM file, and link it against the compiled C file like this and make sure the program runs:
ml64 -c -Zd -Zi -D_WIN64=1 cpuid64.asm Microsoft (R) Macro Assembler (x64) Version 14.39.33428.0 Copyright (C) Microsoft Corporation. All rights reserved. Assembling: cpuid64.asm cl -FAsc -O2 -Zi cpuidmax.c cpuid64.obj Microsoft (R) C/C++ Optimizing Compiler Version 19.39.33428 for x64 Copyright (C) Microsoft Corporation. All rights reserved. cpuidmax.c Microsoft (R) Incremental Linker Version 14.39.33428.0 Copyright (C) Microsoft Corporation. All rights reserved. /out:cpuidmax.exe /debug cpuidmax.obj cpuid64.obj cpuidmax.exe CPUID function 0 returned max functions = 13
The return value 13 is consistent with what the AMD 5950X returns, indicating that 13 is the highest supported CPUID function. Let's now look at the relevant portions of the disassembly of the binary:
main: 0000000140001060: 40 53 push rbx 0000000140001062: 48 83 EC 20 sub rsp,20h 0000000140001066: 33 D2 xor edx,edx 0000000140001068: 33 C9 xor ecx,ecx 000000014000106A: E8 81 00 00 00 call CallCpuid CallCpuid: 00000001400010F0: 8B C1 mov eax,ecx 00000001400010F2: 8B CA mov ecx,edx 00000001400010F4: 0F A2 cpuid 00000001400010F6: C3 ret
You can see that the main() function is in fact compiled as x64 bytecode, and the being 64-bit the two zero arguments are passed in the ECX and EDX registers. The CALL instruction uses a relative displacement to directly call CallCpuid(). This all looks correct.
Now let's open a vcvarsamd64_arm64 Visual Studio developer prompt for ARM64 and recompile the C file as ARM64EC, making sure to pass the -arm64EC switch:
cl -FAsc -O2 -Zi -arm64EC cpuidmax.c cpuid64.obj Microsoft (R) C/C++ Optimizing Compiler Version 19.39.33428 for ARM64 Copyright (C) Microsoft Corporation. All rights reserved. cpuidmax.c Microsoft (R) Incremental Linker Version 14.39.33428.0 Copyright (C) Microsoft Corporation. All rights reserved. /out:cpuidmax.exe /machine:arm64ec /debug cpuidmax.obj cpuid64.obj
And yes, resulting binary can be copied over to an ARM64 device and runs!
Let's take a look at what is in the EC binary. Run a "link -dump -headers -disasm" on the binary to see both the machine type in the headers, and the disassembled code, the relevant output is shown here:
Dump of file cpuidmax.exe PE signature found File Type: EXECUTABLE IMAGE FILE HEADER VALUES 8664 machine (x64) (ARM64X)
#main: 00000001400048B0: D10043FF sub sp,sp,#0x10 00000001400048B4: A9007BF3 stp x19,lr,[sp] 00000001400048B8: 52800001 mov w1,#0 00000001400048BC: 52800000 mov w0,#0 00000001400048C0: 940225F2 bl #CallCpuid$exit_thunk #CallCpuid$exit_thunk: 000000014008E088: A9BF7BFD stp fp,lr,[sp,#-0x10]! 000000014008E08C: D0000049 adrp x9,__os_arm64x_dispatch_call_no_redirect 000000014008E090: F9400929 ldr x9,[x9,#0x10] 000000014008E094: 9000000A adrp x10,000000014008E000 000000014008E098: 9109414A add x10,x10,#0x250 000000014008E09C: F000002B adrp x11,CallCpuid 000000014008E0A0: 9100016B add x11,x11,#0 000000014008E0A4: D63F0120 blr x9 000000014008E0A8: A8C17BFD ldp fp,lr,[sp],#0x10 000000014008E0AC: D61F0160 br x11 CallCpuid: 0000000140095000: 8B C1 mov eax,ecx 0000000140095002: 8B CA mov ecx,edx 0000000140095004: 0F A2 cpuid 0000000140095006: C3 ret
$iexit_thunk$cdecl$i8$i8i8: 000000014008E250: D503237F pacibsp 000000014008E254: A9BF7BFD stp fp,lr,[sp,#-0x10]! 000000014008E258: 910003FD mov fp,sp 000000014008E25C: D10083FF sub sp,sp,#0x20 000000014008E260: D0000048 adrp x8,__os_arm64x_dispatch_call_no_redirect 000000014008E264: F9400110 ldr xip0,[x8] 000000014008E268: D63F0200 blr xip0 000000014008E26C: AA0803E0 mov x0,x8 000000014008E270: 910083FF add sp,sp,#0x20 000000014008E274: A8C17BFD ldp fp,lr,[sp],#0x10 000000014008E278: D50323FF autibsp 000000014008E27C: D65F03C0 ret
Understand what is happening here, because the sequence of events for ARM64EC-to-x64 is very different than for an entry thunk going in the other direction:
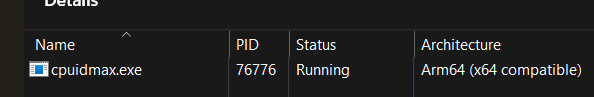
- the machine code is 8664 and the binary is flagged as a hybrid ARM64X binary. Thus why it shown as "ARM64 (x64 compatible)" in Task Manager.
- the original x64 ASM code is in fact preserved as x64 bytecode while the recompiled main() function is in fact native ARM64EC, which is also confirmed by the # name decoration. So we definitely have a hybrid binary.
- the function call from main() to the ASM code is not a direct hop this time. Instead, the call (the BL instruction) targets the automatically generated exit thunk corresponding to the ASM code.
- that exit thunk creates a temporary stack frame as expected, performs some voodoo using scratch registers X9 X10 and X11 (setting X11 equal to the address of the ASM code), then performs an indirect call to something, pops the stack frame and then performs an indirect tail-jump through X11.
- X11 had just been set to the address of the x64 ASM code, but clearly it would not be possible for the ARM64 processor to jump to that code. Therefore the indirect call (the BLR X9 instruction) modified X11 in some way.
You may have probably guessed that the indirect call through X9 was actually an EC bitmap lookup on the address in X11 (which was initially the address of the foreign ASM code). And you would be correct! The exit thunk is using an OS-provided function to query whether the target function (CallCpuid) is native ARM64EC or foreign x64.
Wait? Didn't the compiler know at compile time? No. Remember, the C compiler emits both entry thunks to ARM64EC functions that are being compiled, and exit thunks to function that those ARM64EC functions will call. At compile time the C compiler only had the function signature of CallCpuid(), it knew nothing about the actual implementation or the architecture of that target function. So this is why the compiled code has to be conservative.
Pro tip: for the curious, the Windows 11 SDK defines the ASM macro CFG_ICALL_CHECK_BITMAP which shows the implementation of the EC bitmap lookup. This macro can be found in the file include\shared\kxarm64.h.
This exit thunk mechanism is also documented in Microsoft's ARM64EC call checkers documentation. The call checker performs both the EC bitmap lookup, and swaps registers X10 and X11 when the bitmap indicates a foreign target. You can see the X10 register is loaded with an address (14008E250) which corresponds to another exit thunk which invokes the emulator.
Notice the "MOV X0,X8" instruction in that second exit thunk immediately after the emulator returns back to native. Recall that X8 maps to RAX, the return value register for x64. The thunk is copying that return value to the ARM64 X0 register which is where caller main() will be expecting it.
Now notice, if I modify my test code slightly and turn the direct call to the ASM code into an indirect call:
extern uint32_t CallCpuid(uint32_t EAX, uint32_t ECX); typedef uint32_t (AsmProc)(uint32_t, uint32_t); AsmProc *pfn = CallCpuid; int main() { uint32_t Max = (*pfn)(0, 0); printf("CPUID function 0 returned max functions = %u\n", Max); return Max; }
the compiler can optimize away the first thunk (which sets X11 to point to the target function) and simply use the pointer it just loaded to call the EC bitmap lookup call check from main() directly. This is how an indirect function call is compiled in ARM64EC - X9 and X10 are initialized as before, and X11 is loaded directly with the function pointer. Unlike classic ARM64 which would have simply called the target (via BLR X11), the ARM64EC versions has to first call the checked via BLR X9 and _then_ call the actual target:
#main: 0000000140001D30: F81F0FF3 str x19,[sp,#-0x10]! 0000000140001D34: A9BF7BFD stp fp,lr,[sp,#-0x10]! 0000000140001D38: 910003FD mov fp,sp 0000000140001D3C: 900000E8 adrp x8,__os_arm64x_dispatch_call_no_redirect 0000000140001D40: F9400909 ldr x9,[x8,#0x10] 0000000140001D44: D0000128 adrp x8,pfn 0000000140001D48: F940010B ldr x11,[x8] 0000000140001D4C: 900000C8 adrp x8,0000000140019000 0000000140001D50: 9100A10A add x10,x8,#0x28 0000000140001D54: D63F0120 blr x9 0000000140001D58: 52800001 mov w1,#0 0000000140001D5C: 52800000 mov w0,#0 0000000140001D60: D63F0160 blr x11 0000000140001D64: 910003E4 mov x4,sp 0000000140001D68: D2800005 mov x5,#0 0000000140001D6C: 2A0003F3 mov w19,w0 0000000140001D70: 900000E8 adrp x8,__os_arm64x_dispatch_call_no_redirect 0000000140001D74: 9104C100 add x0,x8,#0x130 0000000140001D78: 2A1303E1 mov w1,w19 0000000140001D7C: 94000007 bl #printf 0000000140001D80: 2A1303E0 mov w0,w19 0000000140001D84: A8C17BFD ldp fp,lr,[sp],#0x10 0000000140001D88: F84107F3 ldr x19,[sp],#0x10 0000000140001D8C: D65F03C0 ret
Clearly, in both the direct function call scenario and the indirect function call scenario, you can see that in order to be "emulation compatible" the ARM64EC compiled code has to incur additional runtime overhead on every indirect function calls to check the ISA type of the target function. This requires additional instructions and obviously additional scratch register overhead on top of the fact that registers X13 X14 X23 X24 are unavailable.
Therefore, ARM64EC has higher register pressure than classic ARM64 and may result in more register spills (the STP and LDP instructions) than classic ARM64.
There is one other subtle detail to point out. I warned you in the previous tutorial to be careful when porting code containing varargs functions (i.e. functions taking a variable number of arguments. Accidentally mismatching call signatures (such as what I did when porting Xformer 10) will result in a crash. I'll show you why.
When a function is known to have variable number of arguments the marshalling code needs to know how many of those arguments were placed on the stack and where. This is why in setting up the printf() call above, you may notice the compiler emitted a strange pair of instructions: MOV X4,SP followed by MOV X5,#0. These registers X4 and X5 correspond to x64 registers R10 and R11 in the ARM64EC context. But R10 and R11 are not used for argument passing in any x64 calling convention. Huh?
What the compiler is doing is loading up X4 with address of the stack where variable arguments would have been put in memory, and X5 is loaded with the count of such arguments - in this case X5=0 since only two arguments are being passed to this printf() call and those are in X0 and X1.
Failing to properly declare a varargs function (by say, not #include-ing the header file which declares a specific function as varags) will cause the ARM64EC compiler to optimize away the setting X4 and X5, which in turns means that function arguments will be lost during marshalling. Worse, having random values in X4 and X5 may cause the marshalling itself to crash. This is the exactly the bad marshalling case I encountered due to my sloppy source code in Xformer 10.
Now let's create a third variant of the CPUID sample that does not require ASM code. If we were compiling for 32-bit x86, no separate ASM file is required since the x86 front-end parser supports inline ASM (the __asm keyword).
But Microsoft by definition banned inline ASM from their 64-bit C/C++ compilers from day one. x64 does not support inline ASM, neither does ARM64 or ARM64EC. This necessitates one of two solutions:
- using a separate ASM file and building that using the MASM macro-assembler (ml64.exe), or,
- using Intel compiler intrinsics which the C/C++ compilers for both x86 and x64 do know how to parse.
Using intrinsics makes it easier to maintain source code which compiles as either x86 or x64. After all, SSE vector instructions and scalar instructions (such as plain old floating point) are virtually identical whether in 32-bit or 64-bit mode.
To make use of compiler intrinsics, simply add #include <intrin.h> to your source code, same as on Linux or with any other compiler. Today, Microsoft's Visual C/C++ (in addition to Gcc, Clang, and of course Intel's own compiler) all support much the same common set of Intel compiler intrinsics. Which makes is so easier to keep source code portable as well.
Let me modify the source code to replace the call to the CallCpuid() ASM function with just simply the __cpuidex() intrinsic call:
#include <stdint.h> #include <stdio.h> #include <intrin.h> extern uint32_t CallCpuid(uint32_t EAX, uint32_t ECX); int main() { // https://learn.microsoft.com/en-us/cpp/intrinsics/cpuid-cpuidex?view=msvc-170 int CpuInfo[4]; __cpuidex(CpuInfo, 0, 0); uint32_t Max = CpuInfo[0]; printf("CPUID function 0 returned max functions = %u\n", Max); return Max; }
Notice when I recompile with the 64-bit x64 compiler and we look at the compiled code that the __cpuidex() intrinsic compiles directly to the Intel CPUID instruction:
main: 0000000140001008: 48 89 5C 24 08 mov qword ptr [rsp+8],rbx 000000014000100D: 57 push rdi 000000014000100E: 48 83 EC 30 sub rsp,30h 0000000140001012: 33 C9 xor ecx,ecx 0000000140001014: 33 C0 xor eax,eax 0000000140001016: 0F A2 cpuid
Great, we have portability! Or do we?
The problem is, intrinsics are _very _ instruction set specific and do not carry over from Intel to ARM. The ARM instruction sets (Thumb, ARM32, ARM64) use vector registers called NEON, not SSE, and define completely different names for what can be very similar operations. ARM compilers do not know how to parse the hundreds of Intel SSE intrinsics. There is the occasional intrinsic such as __mulh() which happens to have identical Intel and ARM meanings and semantics, but these are far and few between.
Worse, ARM64 has no concept of a CPUID instruction like Intel does; ARM processors uses special machine registers to convey their capabilities and there is very little overlap how these capabilities are categorized.
How can we possibly "incrementally port" CPUID to ARM64EC????
In a traditional porting scenario, you find every single Intel intrinsic and try to replace it with some NEON or ARM64-specific intrinsic. Or in the case of CPUID you burn the code down entirely ha ha. This it the part that can take days, weeks, months.
Also, not every Intel intrinsic involves SSE vector registers. The __mulh() and __cpuidex() examples just given operate on integer general purpose register, not vectors. So it might be as simple as 1:1 mapping of intrinsics, or it could have no mapping at all.
I explained in a past tutorial, I was grappling with this porting issue back in 2019. We all wanted to make it as seamless as possible to take Intel source and make it "just work" with the ARM64 compiler (this is even before there was an ARM64EC compiler). And I was also at the same time prototyping an x64 interpreter. I was already writing up a series of helper functions for the interpreter to emulate common Intel instruction functionality. Since these were primarily math primitives for the SSE vector operations, I called this library "Wide Math" and declared the helped in a header file called widemath.h.
Then I realized that by simply wrapping the "widemath" functions with names corresponding to Intel intrinsics, I could trick the ARM64 compiler into accepting these Intel function names and compile them into something rather than failing to compile at all. I called these wrappers "soft intrinsics" or "softintrins" for short. The header file softintrin.h was born, and soon my colleagues and I were adding declarations for dozens of soft intrinsics which eventually proved so useful we pulled it in to the Windows SDK for the Windows 10 "Iron" SDK release (build 20348). Eventually we implemented over 500 x64 intrinsics wrappers for the Windows 11 SV1 "Cobalt" SDK (build 22000) and Windows 11 SV2 "Nickel" SDK (build 22621):
Directory of C:\Program Files (x86)\Windows Kits\10\Include\10.0.20348.0\um
05/06/2021 08:00 PM 20,504 softintrin.h
05/06/2021 08:00 PM 9,687 widemath.h
Directory of C:\Program Files (x86)\Windows Kits\10\Include\10.0.22000.0\um
07/01/2022 06:16 PM 58,351 softintrin.h
07/01/2022 06:16 PM 20,115 widemath.h
Directory of C:\Program Files (x86)\Windows Kits\10\Include\10.0.22621.0\um
09/24/2023 01:22 PM 58,351 softintrin.h
09/24/2023 01:22 PM 20,115 widemath.hDirectory of C:\Program Files (x86)\Windows Kits\10\Include\10.0.26020.0\um
12/15/2023 12:44 PM 59,757 softintrin.h
12/15/2023 12:44 PM 22,075 widemath.h
As of recent build 26020 some additional functions are added. Some softintrins are implemented directly in those headers as inline functions, but the vast majority are implemented as static functions which are packaged up in a library called softintrin.lib:
Directory of C:\Program Files (x86)\Windows Kits\10\Lib\10.0.26020.0\um\arm64
12/15/2023 12:46 PM 1,348,356 softintrin.lib
Directory of C:\Program Files (x86)\Windows Kits\10\Lib\10.0.26020.0\um\x64
12/15/2023 12:45 PM 547,202 softintrin.lib
Directory of C:\Program Files (x86)\Windows Kits\10\Lib\10.0.26020.0\um\x86
12/15/2023 12:44 PM 718,206 softintrin.lib
Your eyes are not deceiving you, softintrin.lib actually _is_ built for x86, x64, as well as ARM64/ARM64EC targets! As you can see in the softintrin.h file, this #if line activates softintrin functionality for ARM64EC targets _or_ for any other target if the macro symbol USE_SOFT_INTRINSICS is defined:
softintrin.h:25:#if defined(_M_ARM64EC) || ((defined(_M_IX86) || defined(_M_AMD64) || defined(_M_ARM64)) && defined(USE_SOFT_INTRINSICS))
What value is there to using softintrins on x64 builds? By building SSE test programs for x64 which are compiled both with the native Intel intrinsics one way and then with the softintrins another way, the two variants of code can be run against each other to check their functionality and correctness. It is presumed that the compiler intrinsics are the "ground truth" and trusted to give correct behavior. By testing on both AMD and Intel hardware I could check the validity of the software implementations against each vendor and validate that they agree on real AMD and Intel hardware. Believe it or not, there are several SSE instructions that give slightly different results on AMD and Intel, at which point I had to choose which behavior to emulate. As I did in Bochs about 15 years ago when the same issue came up, I chose to mimic the AMD hardware behavior in a number of places.
But this still doesn't explain how CPUID can be emulated in software, especially when by design, CPUID definitely gives different results on AMD and Intel hardware. (That's sort of the whole point of CPUID, it is expected that every model of processor returns different results).
Why don't we take a look by actually compiling this latest test code as ARM64EC:
cl -FAsc -Zi -O2 -arm64EC cpuidmax-intrin.c
Microsoft (R) C/C++ Optimizing Compiler Version 19.39.33428 for ARM64
Copyright (C) Microsoft Corporation. All rights reserved.
cpuidmax-intrin.c
Microsoft (R) Incremental Linker Version 14.39.33428.0
Copyright (C) Microsoft Corporation. All rights reserved.
/out:cpuidmax-intrin.exe
/machine:arm64ec
cpuidmax-intrin.obj
Pro tip: Notice that I did not need to add #include <softintrin.h> to the source code, nor did I need to specify the softrintrin.lib on the build's command line. This is because softintrin.lib is automatically added to the default library list for ARM64EC builds, and softintrin.h is implicitly included as part of the intrin.h umbrella header. Always #include <intrin.h> and resist the urge to #include individual intrinsics headers such as xmmintrin.h, as you will break this seamless soft intrinsics support.
The goal for ARM64EC incremental porting was to require as few if not even zero source code changes when porting from x64 to ARM64EC. You only need to #define USE_SOFT_INTRINSICS or specify softintrin.h and softintrin.lib when building for classic ARM64, x64, or x86. For ARM64EC targets, it "just works".
Ok, so let's disassemble the ARM64EC build of cpuidmax-intrin.exe and the answer is revealed:
#main: 00000001400048B0: D10043FF sub sp,sp,#0x10 00000001400048B4: A9007BF3 stp x19,lr,[sp] 00000001400048B8: D10043FF sub sp,sp,#0x10 00000001400048BC: 52800002 mov w2,#0 00000001400048C0: 52800001 mov w1,#0 00000001400048C4: 910003E0 mov x0,sp 00000001400048C8: 94022600 bl #CPUIDEX64$exit_thunk … #CPUIDEX64$exit_thunk: 000000014008E0C8: A9BF7BFD stp fp,lr,[sp,#-0x10]! 000000014008E0CC: D0000049 adrp x9,__os_arm64x_dispatch_call_no_redirect 000000014008E0D0: F9400929 ldr x9,[x9,#0x10] 000000014008E0D4: 9000000A adrp x10,000000014008E000 000000014008E0D8: 910F014A add x10,x10,#0x3C0 000000014008E0DC: F000002B adrp x11,CPUIDEX64 000000014008E0E0: 9100016B add x11,x11,#0 000000014008E0E4: D63F0120 blr x9 000000014008E0E8: A8C17BFD ldp fp,lr,[sp],#0x10 000000014008E0EC: D61F0160 br x11 … CPUIDEX64: 0000000140095000: 4C 8B D3 mov r10,rbx 0000000140095003: 4C 8B C9 mov r9,rcx 0000000140095006: 48 8B C2 mov rax,rdx 0000000140095009: 49 8B C8 mov rcx,r8 000000014009500C: 0F A2 cpuid 000000014009500E: 41 89 01 mov dword ptr [r9],eax 0000000140095011: 41 89 59 04 mov dword ptr [r9+4],ebx 0000000140095015: 41 89 49 08 mov dword ptr [r9+8],ecx 0000000140095019: 41 89 51 0C mov dword ptr [r9+0Ch],edx 000000014009501D: 49 8B DA mov rbx,r10 0000000140095020: C3 ret
The __cpuidex() soft intrinsic is implemented as an exit thunk invoking actual x64 assembly code! Therefore the softintrin.lib static library is itself an ARM64X hybrid binary containing software wrappers which are compiled mostly ARM64EC - but some out of necessity (such as CPUIDEX, RDTSC, RDTSCP, FXSAVE, FXRSTOR, etc.) are implemented as their own Intel instructions and emulated. You can see this for yourself by disassembling softintrin.lib or binaries that you build that use soft instrinsics and noticing that those functions are x64 bytecode.
These and a handful of other softintrins invoke the emulator because they have dynamic behaviour. i.e. the operation can't be statically implemented because the behavior of the operation may be different depending on the emulation settings of that particular process. I'll explain details shortly, but in brief I will explain two of these:
- CPUID's implementation has varied greatly since the original Windows 10 release, and varies even between x86 emulation and x64 emulation. Even the latest Windows Insider builds have CPUID changes for improving compatibility. Therefore what the specific __cpuid() or __cpuidex() behavior is for a specific application is a function of both the Windows OS build and the application itself.
- RDTSC/RDTSCP intrinsics __rdtsc() and __rdtscp() similarly need to invoke emulation because the frequency at which the emulated timestamp counter frequency is not deterministic. Typically the emulation of RDTSC scales the timestamp counter to a virtual 1600 MHz frequency (which is a typical value seen on real AMD and Intel hardware). But this frequency is not set in stone and could change in the future.
But don't just take my word for it, let's probe these instructions deeper!
As I mentioned, CPUID is an incredibly fascinating instruction in terms of what it reveals about the host processor. And it is also quite the challenge to code up when designing an emulator. The overall compatibility of an x86 or x64 emulator rests in part on the quality of the CPUID emulation. Over several years I iterated fine-turning the CPUID information exposed by xtajit and xtajit64 as the emulation capabilities kept improving. Windows 10, Windows 11 SV2, and the latest insider builds return different CPUID results - even between 32-bit and 64-bit emulation modes on the exact same machine!
There are many public CPUID dumping utilities out there, and most spew out too much information for the purposes of this tutorial. So let's write our own CPUID examination tool which I'll call CPUIDEX (as in "CPUID EXamination", and also the __cpuidex intrinsic which it makes use of). I've shared the source code for cpuidex.c and the three small samples from above in this GitHub repository and I welcome you to follow along to build these samples yourself.
Let me show you what the CPUIDEX utility dumps out. Rather than just raw hex code dump of each CPUID function, or "leaf", I am focusing in on specific feature bits which have historically affected emulation performance. In the almost 18 months since I left Microsoft I've been looking at more real CPUs and Windows 11 devices trying to determine what modern Windows devices (based on AMD and Intel processors) all have in common. I'm sad to realize that there are some gaping holes still left in the emulation of CPUID, as well as some technical debt that doesn't seem to have been taken care of after my departure.
Let's first go to a fairly top-of-the-line Intel CPU, my Core i9-12900K "Alder Lake" workstation, as well as my AMD "Zen3" Ryzen 9 5950X workstation. Both sets of outputs after running cpuidex.exe are shown here:
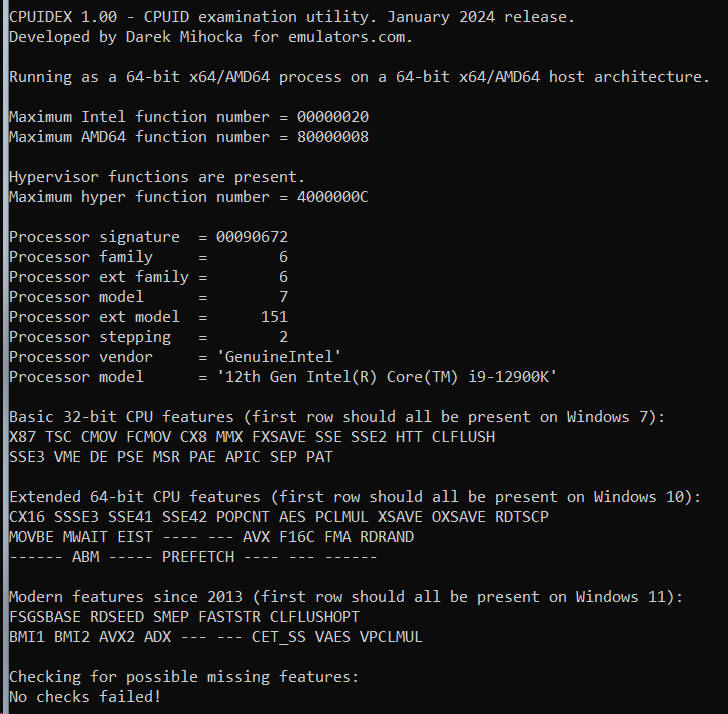
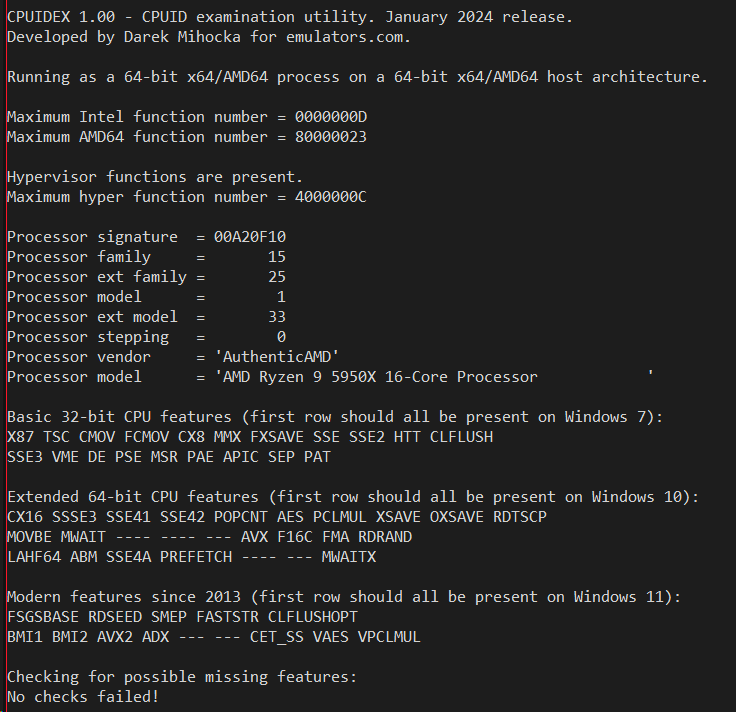
The CPUID instruction returns dozens of pieces of information, and fortunately today's AMD and Intel processors are mostly in agreement in terms of which CPU features they expose. If you look at those two screen shots above, the Windows 7 and Windows 10 features match identically for the first 4 rows of feature bits (save for "EIST" which indicates enhanced SpeedStep but this is mostly moot since all CPUs these days vary their clock speed).
The most basic piece of CPUID information any app needs to start with is the CPU vendor string, a 12-character text string which you can see above is either "GenuineIntel" or "AuthenticAMD" respectively. These two text strings have been baked in to Intel and AMD processors since the 1990's, and today are pretty much the only the vendor strings found in mainstream Windows hardware. In the 1990's in the days of x86 clones there was also "GenuineTMx86" for Transmeta processors and also string for Cyrix and VIA and other clones, but let's assume for the purposes of Windows 10 and Windows 11 we're just seeing the two common ones. The vendor string is important because it gives the application calling CPUID a first estimate of what kind of hardware it is running on and how to query other CPUID functions.
Emulators may choose to insert their own vendor string. For example, Virtual PC for Mac used a "Virtual CPU " string which Microsoft kept for Virtual PC for Windows and even for the emulation on ARM64 as you'll see shortly. The drawback of using a custom string is that some applications _only_ check for the AMD or Intel strings and can malfunction if they find something else. Cinebench 15 was an example of such a defective app.
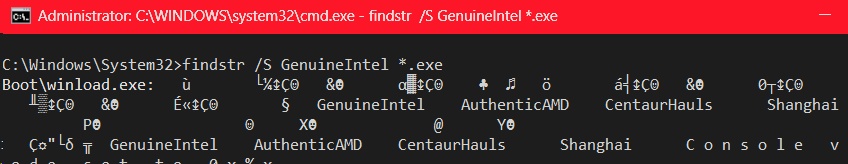
What is interesting is that startup code in some Windows apps does this check, in fact even the Windows loader itself. Try this, go to your C:\Windows\System32 directory and type "findstr GenuineIntel *.exe" and see what spills out. Interesting, "CentaurHauls" and "Shanghai" might be vendor strings? I am actually not aware of these processors if they exist.
The next interesting piece of information is the model string, a 48-character block of text which is generally the text string you see in Task Manager's CPU pane. For example, look at the processor model above for my 5950X and you'll see "AMD Ryzen 9 59590X 16-Core Processor" matches exactly with what Task Manager shows on the same machine:
So now we know how Windows extracts that text.
Next, dating back to the original first days of CPUID instruction thirty years ago, there is a 32-bit integer called the processor signature. This was the original way to uniquely identical a specific generation and model of processor by assigning a "family" and "model" to it, as well as a "stepping" number as newer version of its silicon were taped out. For historical reasons for compatibility with old Pentium II and Pentium III processors, Intel has settled on a family number of 6 for its processors, while AMD has mainly stayed at family 15 for its chips. For similar backward compatibility reasons as the vendor string, you don't want to keep changing the family number all the time, it will break old 1990's software. So more recently, unused bit of the signature have been used to encode "extended family" and "extended model" numbers which newer software can use to identify the specific processor. These extended numbers _do_ increase monotonically each year, and you can see Intel is up to extended model 151 as of two years ago and counting, while AMD chooses to also bump up their extended family number usually about once per year.
The rest of the information is a dump of the dozens of CPUID feature bits such as the familiar X87 SSE SSE2 SSE3 AVX AVX2 features identifying support for various floating point and vector instruction, as well as some lesser known ones. Most people think of of AVX2 as a single blob of new instructions that was added in 2013 with the Intel "Haswell" Core i7 processor, but AVX2 really came as a bundle of features that also includes ABM BMI1 and BMI2 bit manipulation instructions, 16-bit floating point F16C feature, the FMA fused-multiply-add feature and others.
Generally, once a feature appears (either in AMD or Intel) it rarely goes away in future generations. HLE and RTM features (for transactional memory) which do appear on my Core i7 6th generation "Skylake" devices are absent now as those features were deprecated by Intel. It seems that making large blocks of memory atomically commit as a single transaction is not trivial on a highly multi-core processor.
CPUID features may also arrive in a different order on AMD and Intel which can make application compatibility trickier. What AMD calls the ABM feature (and Intel calls LZCNT) arrived in AMD a few years before Intel added it (as you guessed it, part of the Haswell launch with AVX2). This was a big problem about 15 years ago as AMD and Intel were introducing their own specific instructions which did not run on each other. This was a Bad Thing for software developers.
Therefore I was curious to see what today's bare minimum 250 to 300 dollar devices such as the Surface Go and Lenovo Ideapad expose. One would think at that price level those processors would mimic something old; yet both these devices are Windows 11 compatible and therefore must meet the official hardware bar of being at least 8th generation Intel hardware - which places those CPUs squarely in the 2017 timeframe. Let's take a look, the output from Lenovo's Intel Pentium Silver on the left and the Surface Go's Intel Pentium Gold on the right:
The low-end CPUs surprisingly support a large set of functionality of modern processors despite only support Windows 7 era SSE - they do not just go back to the features of the Windows 7 days. Features such as XSAVE, OXSAVE, MOVBE, RDRAND, RDSEED, and ABM, which are either related to AVX or didn't appear on the Intel Core i7 until 2013 _are_ supported. While the original SSE4.1 or 4.2 processor from 2008 or 2009 did not support any of those features, the bare bones processors of today do so that even the Pentium Silver is able to meet the Windows 11 hardware bar.
In the context of emulation or app compat in general, to maximize compatibility you want to make sure to expose a sane set of CPUID features suitable for the time period. This means that you might end up supporting a superset of what AMD and Intel provide in their individual processors, or a superset of 2008 features and 2013 features to leave as few gaps as possible as the Pentium Silver and Gold do. This is exactly what the Intel emulation on ARM64 does in the latest Windows insider builds (currently as I am composing this post build 26040 is the first and latest Insider build of 2024 which came out on January 26).
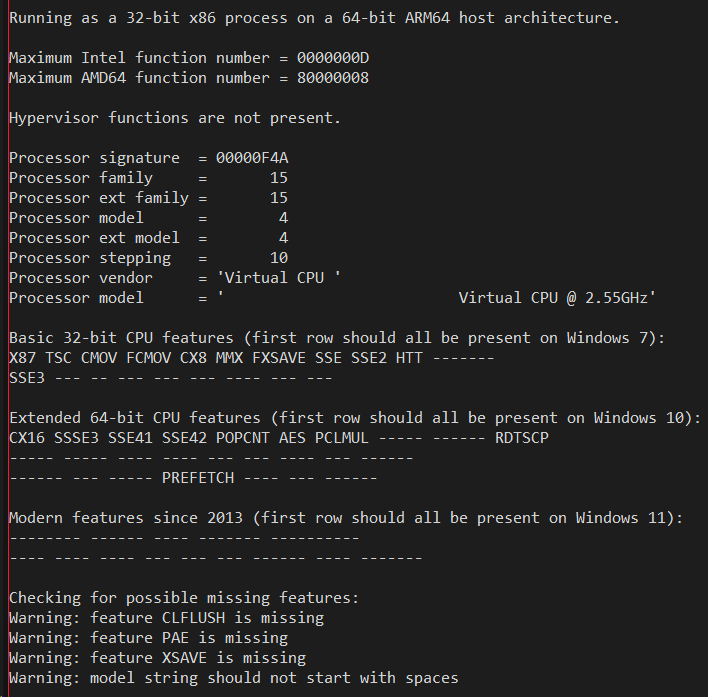
I said this was iterated over a period of years. Let's first take a look an old build of the emulator from the Windows 10 days. One of my devices, the ASUS Novago which is based on the now unsupported Snapdragon 835 processor, is still running a Windows 10 build from 2019. These builds by design lacked 64-bit emulation, so I have to run a 32-bit x86 build of cpuidex.exe to see what the 32-bit emulation is claiming for CPUID. Let's take a look:
Notice how stripped down the emulator's CPUID is. The vendor string says "Virtual CPU " which is a strong hint this ran emulated. Notice also that the CLFLUSH feature (which has been around since the days of SSE2), CX16 (16-byte Compare Exchange support in 64-bit processors), and SSE4.2 are not supported, nor is XSAVE or any of those AVX2-era instructions that Pentium Silver does support. In fact the complete lack of _any_ CPUID features found in Windows 11 hardware is embarrassing today. But that was the state we were at in 2019.
Notice also the processor signature F4A which maps to family/model/stepping of 15, 4, 10. This is quite a clever tuple of numbers if may say so myself. I had been scouring the CPUID databases for a family/model/stepping that appeared in common in both AMD and Intel processors. There were almost none to be found, as Intel tended to use family 6 and AMD tended to use family 15. But it turned out that 15-4-10 was common to both an Intel Pentium 4 processor and an AMD Athlon processor at around the Windows XP timeframe. And so 15-4-10 was chosen as the virtual CPU signature as it mapped to something that existed in the real world by both vendors.
As we rolled out Windows 11 on ARM two years later, we plugged a few emulation holes such as implementing SSE4.2. Why I call SSE4.2 a hole is because the emulator already supported AES (the encryption instructions) which appeared in Intel processors in 2010, a year _after_ SSE4.2. Any any AMD processor that supports AES similarly also support SSE4.2. So we had this compatibility hole that didn't exist in real hardware, where apps might assume that if AES was present then surely SSE4.2 was present. (And yes, we found real world software that was tripping over exactly this hole!)
The next pair of screen shots is the output of running CPUIDEX both as emulated x86 code and emulated x64 code on Windows 11 on ARM SV2 - on the left is x86 on the right is x64 as taken on the Qualcomm Snapdragon 7cx based Galaxybook Go:
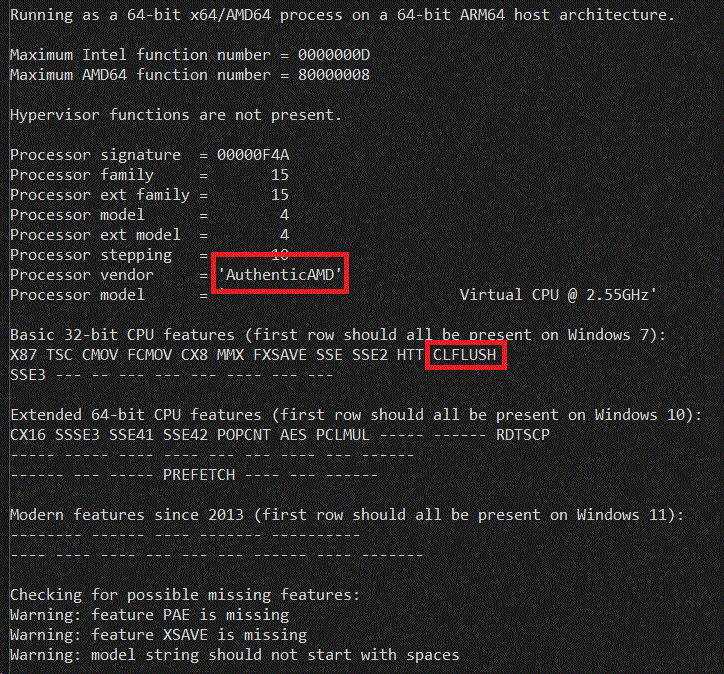
Notice that the processor signature is still F4A, but the vendor string on the 64-bit version has changed from "Virtual CPU " to "AuthenticAMD"! Remember how I said that nowadays it is just down to two vendor strings. It turns out that some 64-bit applications _presume_ there are only the two vendor strings, and will malfunction is they see something like "Virtual CPU ". Yet this is not much of a problem with 32-bit apps since they tend to be older and were written back when you had to be compatible with Transmeta and Cyrix and Via and other "clone x86" processors. Note also that CLFLUSH is now also implemented, which finally passes the Windows 7 compatibility bar. The XSAVE support is still missing though.
Windows 11 on ARM now exposes the CX16 (Compare Exchange 16 bytes) feature even in 32-bit emulation. This is a good move, because a) this is what real AMD or Intel hardware does, it doesn't change the CPUID information based on the bitness of the caller, and b) it lets the application know that it is running on a 64-bit host OS. This allows things like Valve's Steam client (which is a 32-bit x86 binary) to know that it can safely launch 64-bit games. This is in contrast with Windows 10 where the emulation tried to lie and pretend the whole system (including the Windows kernel) was 32-bit and that WOW64 did not exist. This led to its own set of compatibility bugs in Windows 10 which I am now glad are gone for Windows 11.
Fast forward to the latest Windows Insider builds (26020 or 26040), and what you will find is the 32-bit x86 output is much the same to the Windows 11 SV2 output shown above. I don't detect much "churn" in the 32-bit emulation over the past year, certainly not like the vast improvements in 64-bit emulation over the past year or two. One of those 64-bit improvements is a completely different signature which I pushed for shortly before I departed Microsoft and I'm glad to see it made it in:
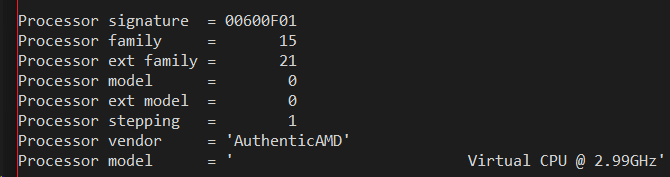
I had suggested upgrading the signature from F4A to 600F01 to leapfrog the signature from what was a mid-2000's era AMD Athlon processor to a 2011 AMD Athlon64 processor from the "Bulldozer" era. The significance of this is that 2011 marked the first time in years where both Intel and AMD lined up their instruction sets. This lock-step matching of CPU features has persistent now in the decade since. Prior to 2011, AMD and Intel had veered off in different directions - AMD adding their own "SSE4a" instructions while Intel added SSE4.1 and 4.2 and AES. AMD did not sync to Intel's new instructions until 2011's release of the extended family 21 when it added SSE4.1 SSE4.2 and AES in one big sync.
The other significance of the year 2011 is both AMD and Intel released AVX 256-bit vector extensions that year (AMD in "Bulldozer" and Intel in "Sandy Bridge" architectures). To make future forward progress of adding AVX and AVX2 support meant exposing CPUID information of at least that time era or newer. So upgrading the CPU signature now paves the way for Microsoft to implement at least AVX support.
What Microsoft still needs to do very soon to keep up with AMD and Intel and meet the Windows 11 bar:
- the fact that the 64-bit x64 emulation is evolving while the 32-bit x86 emulation is stuck in maintenance mode is a Bad Thing, because on real hardware CPUID doesn't expose different vendor strings or signatures between 32-bit and 64-bit execution modes. This is a compatibility train wreck waiting to happen. The two CPUID implementations need to sync up to match what real hardware does (and what software expects).
- almost every single real AMD and Intel processor I've checked returns a left-justified model string. The emulation is padding the string with spaces first, which right-justifies the text. Minor, but it is another way software might get confused or worse, realize that it is running under emulation.
- even without AVX support, the emulators need to implement the bare minimum Windows 11 hardware bar of adding XSAVE, RDRAND, MOVBE, and a handful of other features to match or exceed the lowest-end devices such as Surface Go. Right now the emulation fails to meet Microsoft's own Windows 11 hardware bar for x86!
- as I pointed out before, the Steam Hardware Survey shows the prevalence of AVX on gaming machines well above 96% and AVX2 above 92%. Microsoft must add AVX and AVX2 support ASAP before too many games and applications go AVX-only - just as happened five years ago with the big migration of software from 32-bit x86 to 64-bit x64 and Microsoft was unprepared.
- but "adding AVX" really implies AVX2 (far more useful than AVX alone) and the bundle of features AVX and AVX2 came with such as BMI1 BMI2 FMA and RDRAND. AVX and AVX2 cannot just be implemented in isolation.
I call these issues out as potential compatibility bugs. But these are also potential security holes, as all off the missing features and deviations from real Intel hardware are an easy way for any software to detect it is being emulated and choose to behave differently - anti-cheat logic in games is an obvious one that comes to mind.
There is also the very obvious fact that implementing AVX (especially AVX2 which has some nice accelerated integer instructions) maps much more cleanly to ARM's NEON instruction set and would result in faster emulation.
When one looks at what Apple did in Rosetta 2 on their ARM64 hardware, Rosetta chooses to return almost exact CPUID information as a real Intel processor they'd used in past devices - the Intel Xeon X5675 to be exact based on the signature and features. It's not a latest-and-greatest Xeon model, and the only hint you are running emulated is that the vendor string states "VirtualApple" as the processor brand as you can see from the output from my Macbook:
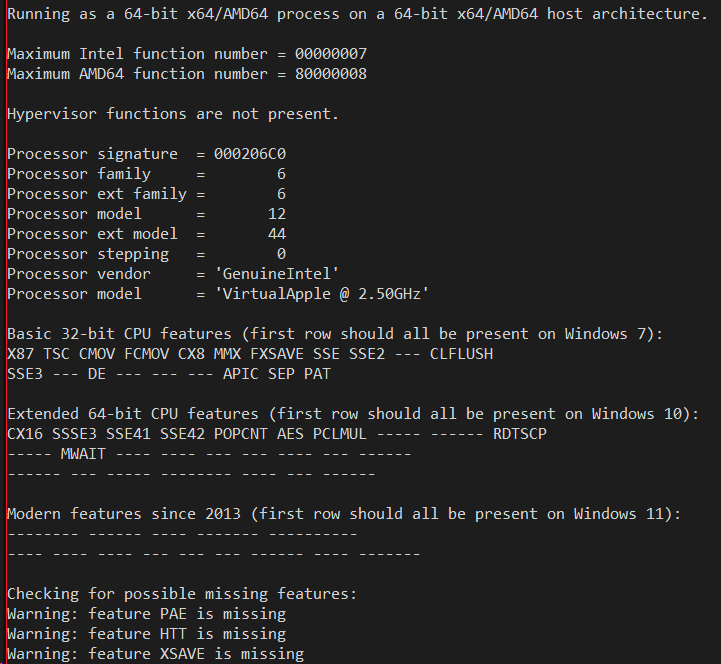
Rosetta exposes some of the CPUID features that Microsoft has been lacking such as CLFLUSH, DE (debug extensions), APIC, SEP, PAT and MWAIT, which are all very old features and inexplicable that Microsoft does not expose yet.
Ironically, Rosetta's CPUID information returns "GenuineIntel" and the Xeon information, while Microsoft is actually emulating (as per the screen shots above) an AMD processor, ha! I have to get out of the habit of saying "Intel emulation on ARM64" and start saying "AMD emulation on ARM64". Yes, both the soft intrinsics and the XTA translators are emulating AMD behavior more so than Intel behavior.
How an emulated process launches
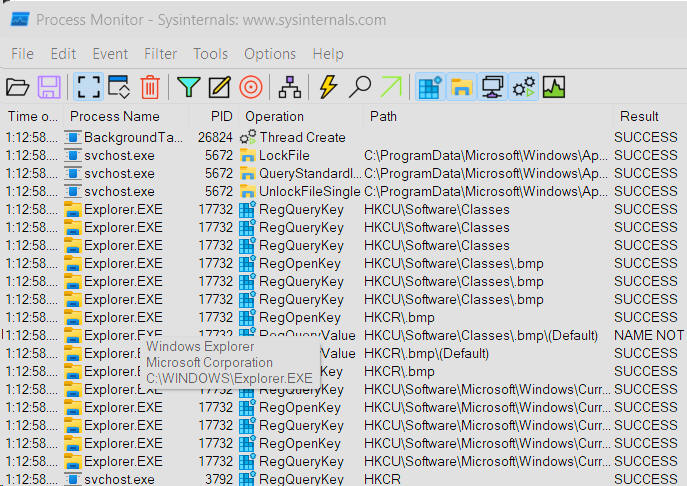
Let's look at just how CPUIDEX.EXE or any other emulated or ARM64EC process actually gets launched. I will point you at a useful tracing tool called Process Monitor, or "ProcMon" for short. Download the .ZIP and extract it. You should find three binaries - PROCMON.EXE (the x86 version), PROCMON64.EXE (the x64 version), and PROCMON64A.EXE (the ARM64 version). Depending on the hardware you have available, use either the x64 or ARM64 version for this first part (i.e. the native version for your hardware, don't run the x86 version).
Launch PROCMON64 (or PROCMON64A) and let's try to run the 32-bit version of CPUIDEX.EXE we already built. When ProcMon loads up you'll see a bunch of trace output for the shell that looks like this:
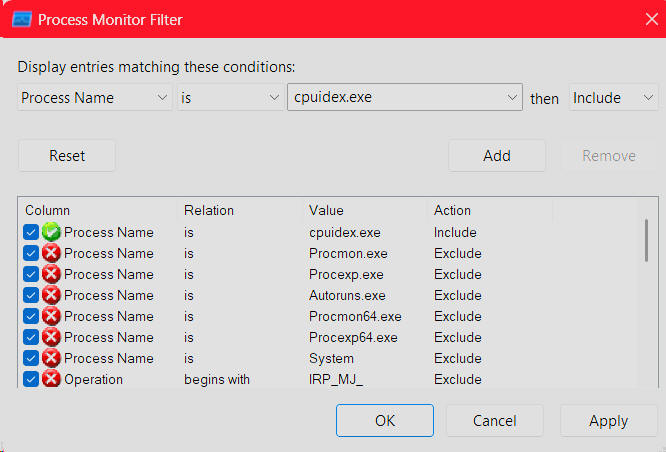
To mute this spew of activity, click the Filter icon (the green funnel) and add a new filter clause to only include process names that match cpuidex.exe, as shown here, and click OK:
You will now see a blank trace window. Go ahead and run cpuidex.exe once (that it just spew output and terminates is fine, ProcMon has captured what it needs). Your window will display trace information and immediately near the top you will notice file activity on the files C:\Windows\System32\wow64.dll and wow64base.dll wow64win.dll etc. This is the OS loading the WOW64 layer into a 32-bit process. Next, there is a registry lookup which queries a key: HKEY_LOCAL_MACHINE\SOFTWARE\Microsoft\Wow64\x86 which then looks for several values - first under the name of the executable (cpuidex.exe) which fails because it finds nothing. Then it looks for a default entry under that key, which hits and on my AMD 5950X machine loads a value "wow64cpu.dll" as shown:
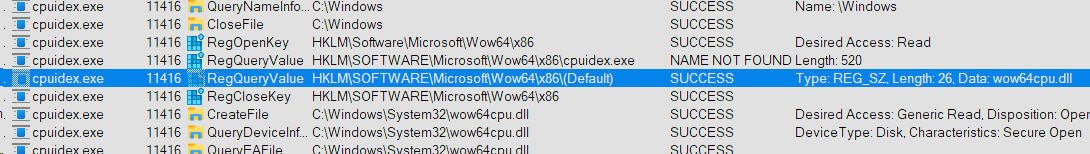
A few steps later it loads that DLL image. wow64cpu.dll is the hardware sandbox I mentioned before which emulates 32-bit mode on a 64-bit AMD or Intel processor. This is done using hardware virtualization, not software emulation.
Pro tip: on an ARM64 device WOW64 has to sandbox two 32-bit instruction sets - x86 and ARM32/Thumb2. If you poke around the registry on an ARM64 device, you will in fact see both HKEY_LOCAL_MACHINE\SOFTWARE\Microsoft\Wow64\x86 and HKEY_LOCAL_MACHINE\SOFTWARE\Microsoft\Wow64\arm registry keys, with latter returning the value wowarmhw.dll (the hardware sandbox for 32-bit ARM). Cool, huh?
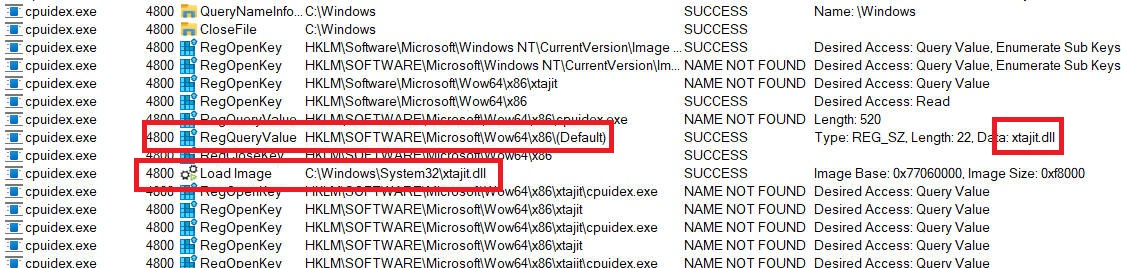
Repeat this same x86 experiment on the ARM64 device, you will see the x86 registry key return a different default DLL - xtajit.dll - this is the 32-bit x86 to ARM64 translator:
This is how the OS knows where to locate a 32-bit emulator (whether hardware sandbox or software translator) to inject into the 32-bit process. You should now realize that the x86-to-ARM64 translator is a pluggable component listed in the registry. This is the key to plugging in other implementations from Microsoft or third parties. The Wine 9.0 release notes recently disclosed that Wine now implements that same registry key, opening the door for third party emulators on Linux such as FEX to plug in. Very cool! Obviously the emulator that kicks in on macOs is Rosetta today. What would be far more interesting to me (as a Windows user and developer) would be to see a third party emulator used for Wine on Linux get ported over to Windows as an alternative to xtajit.dll and xtajit64.dll.
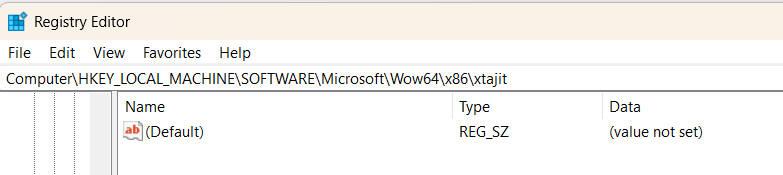
Notice above that right after the load of the translator there is a series of failed attempts to open subkeys "xtajit" and "xtajit\cpuidex.exe". Those keys are not there by default, so what happens when we help it along by creating such an "xtajit" sub-key in the registry? Let's do that:
Now clear the trace window and re-launch the test binary cpuidex.exe. This time there is very interesting output as the system repeatedly searches through a sequence of values on the sub-key we just added. Some of these have self-evident names, can you guess what they do?
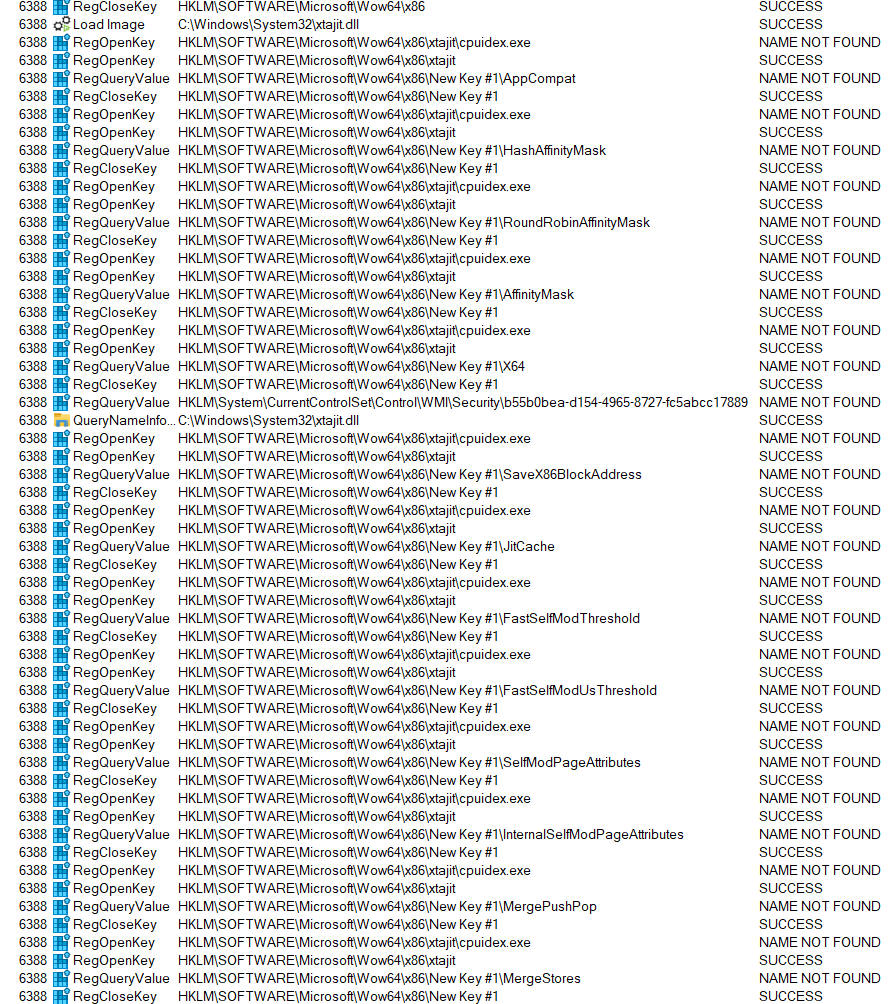
To make it easier to see, let's just filter on the RegQueryValue events:
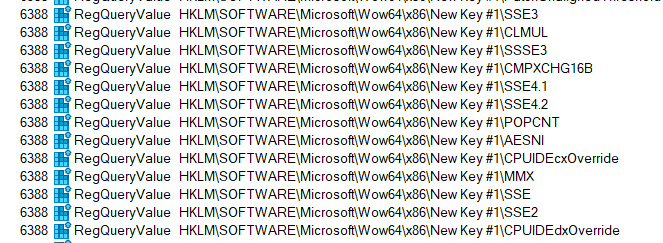
I know what those do, but I will leave it to you the reader to go down that rabbit hole of exploration and figure out how to assign values to and make use of those registry entries.
You can trivially discover that you can do exactly the same with the 64-bit emulation side of things by tracing the startup of an emulated x64 process and then creating the empty "xtajit64" sub-key which repeatedly gets queried after xtajit64.dll is loaded. Then you can watch it query very similar sounding registry values as in the 32-bit case:
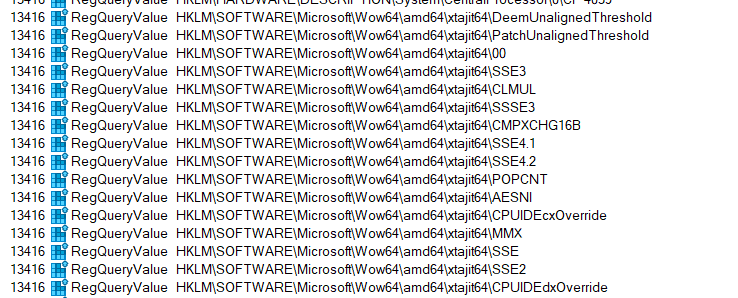
There are many dozens of these values that are queried - can you figure out what each does?
In the case of 64-bit emulation, there already is a pluggable third party emulator (of sorts) - the xtabase x64 interpreter which I'd written as a test and validation tool has been included in both Windows 11 SV1 and SV2 (builds 22000 and up) for almost three years. It was my original predecessor to xtajit64.dll during development and features extras such as: implementation of the CPUID ABM feature (which is mostly just implementing the LZCNT instruction which AMD had introduced over 15 years ago), very accurate 80-bit x87 floating point emulation using a pure software 80-bit floating point emulation package, and more accurate and deterministic EFLAGS arithmetic flags emulation than JIT translations. That is why xtabase was used as the reference interpreter when getting the JIT up and running.
You can try xtabase yourself easy enough. Just go into the registry and make an edit from this value:
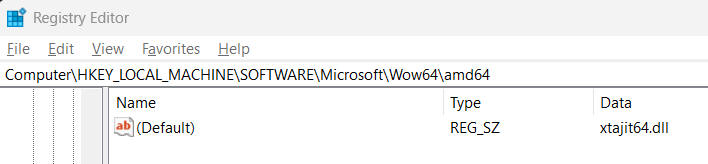
to this value:
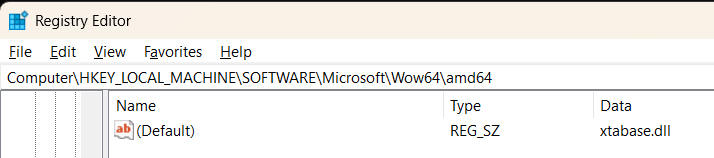
or as I like to do it, use these two command lines (run from an elevated Administrator prompt) to switch back and forth between interpretation and JIT:
reg add
HKEY_LOCAL_MACHINE\Software\Microsoft\Wow64\amd64\ /ve /t REG_SZ /f
/d xtabase.dll
reg add HKEY_LOCAL_MACHINE\Software\Microsoft\Wow64\amd64\ /ve
/t REG_SZ /f /d xtajit64.dll
We started this tutorial with native compilation of ARM64EC, followed the rabbit hole into an entry thunk and into emulated code, probed CPUID's behavior, looked at the emulation bootstrapping process, and seen how to swap JIT for interpretation. Now let's look at actual code translations.
There is something very cool you can do in a hybrid binary, which is that you can run both native ARM64 instruction and emulated x64 instructions. In fact, you can even dynamically JIT both x64 bytecode and ARM64 bytecode and run them both!
How does the OS know if a given blob of code should be emulated or run natively? We already know that answer - the EC bitmap from the previous tutorial. As I stated, the OS populated this bitmap as EXEs and DLLs are loaded and unloaded based on each binary's address range map which specifies which pages of static code are native and which are foreign. But what about dynamic allocations? There is an API for that - VirtualAlloc2() which was added for Windows 10 on ARM.
If you consider the traditional way that executable code pages have been allocated in Windows for over 20 years, it was done using the older VirtualAlloc() function call, for example like this:
void *AllocateReadExecute(size_t numBytesToAllocate)
{
return VirtualAlloc(NULL, numBytesToAllocate, MEM_COMMIT, PAGE_EXECUTE_READ);
}
This simple wrapper function calls VirtualAlloc() to allocate a specific size of virtual address space, commit pageable memory, and mark the memory as both read-only and executable. One can then use subsequent calls to VirtualProtect() to change the protection of a code page to writeable, JIT some code, and then change it back to read-only. Pro tip: it is always good practice to write-protect your dynamically generated code to protect it from malware and accidental overwrites.
If we call this function and display the output we see that it successfully allocates a block of memory:
void *AddressRX1 = AllocateReadExecute(8*64*1024);
printf("GetLastError = %X %u\n", GetLastError(), GetLastError());
printf("Allocated classic RX address %p\n", AddressRX1);GetLastError = 0 0
Allocated classic RX address 000002664D710000
Fantastic. On real AMD and Intel hardware this technique allocates executable pages of code which can be run as Intel bytecode. On an ARM64 device if you run this code as a classic ARM64 process, it will allocate executable pages of native ARM64 code. Something is missing - the ability to tell the OS I want the memory marked as x64 code. The EC bitmap is read-only to user-mode code, so it is not possible to directly manipulate the bitmap even if you could (rather easily) find its location in memory.
For this purpose, the new VirtualAlloc2() function is used. It supports applying additional attributes to the allocation, such as specifying the architecture of the allocation.
Using the sample code on Microsoft's documentation page, one can easily write an allocation function which accepts an IsEC argument to select the x64 or ARM64 architecture of the allocation:
void *AllocateReadExecuteEc(size_t numBytesToAllocate, bool IsEC) { MEM_EXTENDED_PARAMETER Parameter = { 0 }; Parameter.Type = MemExtendedParameterAttributeFlags; #if _M_AMD64 || _M_ARM64EC Parameter.ULong64 = IsEC ? MEM_EXTENDED_PARAMETER_EC_CODE : 0; #else IsEC = false; #endif // We can use MEM_COMMIT directly without a MEM_RESERVE and VirtualProtect() step ULONG allocationType = MEM_COMMIT; // ULONG allocationType = MEM_RESERVE; DWORD protection = PAGE_EXECUTE_READ | PAGE_TARGETS_INVALID; void *Address = VirtualAlloc2 ( GetCurrentProcess(), NULL, numBytesToAllocate, allocationType, protection, &Parameter, 1); return Address; }
This new function can be used as a replacement for the original one-liner, as it can be compiled x86, x64, ARM64EC or classic ARM64.
Note the use of the #if AMD64 || ARM64EC preprocessor guard. I must allow for either ARM64EC or x64 compilations to specify the EC setting. This makes sense because if we are incrementally porting over some x64 code that performs JIT which original emitted x64 bytecode, and our goal is to eventually modify that JIT to emit ARM64 bytecode, then we have to allow for the possibility that the JIT engine itself remains emulated while what it emits is ARM64. Got that? The allocation code above will work regardless of what stage of partial porting our code is at. In fact, the checking of ARM64EC is superfluous since I already pointed out that _M_AMD64 implies that _M_ARM64EC is also set. I am doing the check explicitly to call this out more clearly.
Note that if you attempt to allocate ARM64EC code pages on a real AMD or Intel system, the allocation will fail of course. This trick only works on an ARM64 device. I haven't check, but it would be very nice if Wine supported the VirtualAlloc2() function. Based on my testing and their documentation, it looks like Wine's support of x64 emulation and ARM64EC is very limited right now.
So now we have the ability to do an x64 emulation vs. native ARM64 bake-off in the same process and do it dynamically. This is my new preferred method of doing emulator validation by the way, since my old technique of writing hand-coded ASM is quite tedious. And ARM64EC makes it so trivial to do.
If I now add the VirtualProtect() call and jam some bytes into the allocation, we see that it works nicely proving that in fact we can scribble code and data into a writeable ARM64EC code page:
DWORD OldProtect = 0; SetLastError(0); BOOL Status = VirtualProtect(AddressRXEC, 8*64*1024, PAGE_EXECUTE_READWRITE, &OldProtect); printf("GetLastError = %X %u\n", GetLastError(), GetLastError()); printf("VirtualProtect returned %d\n", Status); if (Status != 0) *(uint32_t *)AddressRXEC = 0x12345678; printf("EC code page start with the value %08X\n", *(uint32_t *)AddressRXEC);
Output:
GetLastError = 0 0
Allocated EC code RX address 00000220218E0000
GetLastError = 0 0
Allocated native RX address 0000022021960000
GetLastError = 0 0
Allocated classic RX address 00000220219E0000
GetLastError = 0 0
VirtualProtect returned 1
EC code page start with the value 12345678
GetLastError = 0 0
VirtualProtect returned 1
GetLastError = 0 0
VirtualProtect returned 1
Now you have the tools necessary to scribble any arbitrary x64 or ARM64 bytecode to memory and execute it dynamically on an ARM64 device. As our first experiment let's create two trivial functions which only increment an input argument and then return using a RET instruction - one using the x64 RET opcode (a single-byte instruction C3) and the other the ARM64 RET opcode D65F03C0.
Let's generate both variants (and sorry for the hex code, I have my opcodes memorized!) and we have to be sure to tell the OS to flush the instruction cache to indicate that we have scribbled writable code:
// both X64 and ARM64EC code pages successfully allocated uint8_t *X64Code = (uint8_t *)AddressRX2; uint32_t *A64Code = (uint32_t *)AddressRXEC; // emit the x64 ADD + RET X64Code[0] = 0x8B; X64Code[1] = 0xC1; // MOV EAX,ECX X64Code[2] = 0x83; X64Code[3] = 0xC0; X64Code[4] = 0x01; // ADD EAX,1 X64Code[5] = 0xC3; // RET FlushInstructionCache(GetCurrentProcess(), X64Code, 4096); // emit the ARM64 ADD + RET A64Code[0] = 0x11000400; // ADD W0,W0,#1 A64Code[1] = 0xD65F03C0; // RET FlushInstructionCache(GetCurrentProcess(), A64Code, 4096);
Now yes I could have used a simpler "LEA EAX,[ECX+1]" instruction to increment the input argument, but I have a reason I'm doing it this way. Ok, so now we just need to dispatch each of the code sequences. We know that this will happen "under the hood" via an EC bitmap lookup and possible invocation of the emulator, so we just code up a plain old indirect function call as done in plain C:
PFN is defined as a function pointer type taking a 32-bit integer as input and returns a 32-bit integer. That is used to create two function pointers to each of the x64 and ARM64 code blocks which call a common test harness function to run and time the execution of each:
typedef uint32_t (PFN)(uint32_t); PFN *pfnX = (PFN *)(void *)X64Code; PFN *pfnA = (PFN *)(void *)A64Code; RunAndTimeFunction(pfnX); RunAndTimeFunction(pfnA);
This is pretty straightforward "micro-benchmarking 101" with the cool twist of measuring dynamically generated code of two different ISAs!
Since I know I will be running on various ARM64 hardware that is clocked at exactly 3000 MHz, I can run 3 million iterations of the test code such that elapsed milliseconds == clock cycles per iterations. i.e. if calling the test function takes 1 clock cycle per iteration the execution time will be 3 million clock cycles, which at 3.0 GHz or 3000 MHz is 1 millisecond. Of course in reality each iteration will take longer, that's good since the longer the execution the more accurate the computed cycle count is. To improve accuracy let's run 10 rounds of the test. This is the test harness function:
#define ROUNDS (10) uint32_t RunAndTimeFunction(PFN *pfn) { DWORD StartTick = GetTickCount(); uint32_t Total = 0; for (unsigned round = 0; round < ROUNDS; round++) { // Reset the total each round Total = 0; for (unsigned i = 0; i < 3000000; i++) { Total = (*pfn)(Total); // FlushInstructionCache(GetCurrentProcess(), pfn, 4096); } } printf("%5u milliseconds elapsed per round\n", (GetTickCount() - StartTick) / ROUNDS); printf("final result total = %u\n", Total); return Total; }
When this code is compiled as ARM64EC using this command line:
cl -O2 -FAsc -arm64EC va2.c
and run on the Samsung Galaxybook 2 Pro 360 (a 3.0 GHz Snapdragon 8280 device), this is the output:
187 milliseconds elapsed per round
final result total = 3000000
9 milliseconds elapsed per round
final result total = 3000000
187-cycle round trip through the EC bitmap + exit thunk + emulator for x64, and 9-cycle round trip for EC bitmap + native indirect call for ARM64EC. This is consistent with my earlier claim that ARM64EC-x64 transition round-trip time is on the order of 100 to 200 clock cycles (depending on the particular ARM64 hardware).
We can convince ourselves that this is doing the EC bitmap lookup by looking at the generated compiled code for the above function. The X21 register is loaded with the address of the EC bitmap check _outside_ of the loop:
0001c 90000008 adrp x8,__os_arm64x_dispatch_icall
00020 f9400115 ldr x21,[x8,__os_arm64x_dispatch_icall]; 70 : Total = (*pfn)(Total);
00044 aa1603eb mov x11,x22
00048 9100028a add x10,x20,|$iexit_thunk$cdecl$i8$i8|
0004c d63f02a0 blr x21
00050 d63f0160 blr x11
00054 51000673 sub w19,w19,#1
00058 35000013 cbnz w19,|$LN7@|
In fact, the ARM64EC compiler is intelligent enough to realize that this is a hot loop calling the same target, so the pointer to the EC bitmap check is cached in a register (thus the BLR X21 instruction).
Pro tip: for correctness reasons the compiler does not assume that the result of the EC bitmap will yield the same result every time even though the function pointer being dispatched is invariant (and 99.999% of the time this will be true). The reason for this is that (as highly unlikely and stupid as this would be) the target address could be remapped into the opposite architecture - i.e. the thread is frozen, the target page protection is modified and remapped to native ARM64EC, and then the thread is unfrozen. Normal people don't write code like this, but I can totally imagine anti-cheat code in a game doing something like this.
Can we determine what is the cost of a translation? Yes we can! See the commented out call to FlushInstructionCache() in my test loop? Oh yes, we're going there! Uncomment that line of code and recompile and re-run the test. Flushing the instruction cache sends a callback to the x64 translator to flush any cached translations it may have for that target function. Flushing the i-cache is costly enough for native code, it's extra costly when a dynamic translator is involved. In fact you can see that the cost of emulating each iteration of the indirect call has now gone up over 50-fold for emulated x64 and 300-fold for native ARM64:
10812 milliseconds elapsed per round
final result total = 3000000
3018 milliseconds elapsed per round
final result total = 3000000
This allows us to deduce that the "cost of JIT" is on the order of 10000 clock cycles for even the most trivial block of x64 code. This has always been especially problematic for JIT-on-JIT scenarios (which is what this simple test case is) where the emulated x86 or x64 application is generating dynamic Intel bytecode frequently which then has to be translated to native ARM64 code. Javascript in x86 and x64 web browsers (or as I demonstrated in the previous tutorial, the Javascript engine in Microsoft Office) end up invoking the JIT-on-JIT scenario.
One workaround for JIT-on-JIT is to interpret at one of those two levels. Flipping the registry key to use xtabase.dll instead of xtajit64.dll now gives a JIT-on-interpreter scenario, which after re-running the test interpreted the run time drops and performance goes up!
8726 milliseconds elapsed per round
final result total = 3000000
2843 milliseconds elapsed per round
final result total = 3000000
Pretty cool, huh? Interpreter beats JIT in some cases - not a new revelation as I first documented this effect back in 2008 when I was writing about the Bochs x86 interpreter and QEMU's x86 translator at the time.
In my initial design of xtabase I had intended to implement xtabase.dll as a hybrid JIT interpreter, much like a Java hotspot VM. At application launch, all code would run interpreted until certain x64 code blocks reached a threshold and then would get translated by a JIT. This way short-lived Javascript would never get unnecessarily translated only to be flushed milliseconds later. Unfortunately the decision was made to keep interpreted mode and JIT mode as separate components, which in hindsight is something I wish I could go back in time 3 or 4 years and rectify.
A potential benefit of combining JIT and interpreter into a single engine is that it can simplify the JIT implementation. Since the interpreter is already correctly emulating 80-bit x87 floating point, it is perfectly valid to keep complex or rare operations (which are usually the same things, think 80-bit floating point) purely interpreted and leave JIT to tackle the common simpler code sequences. For example, if a hot loop of code is performing 80-bit floating multiplies or square root operations, it does not make a lick of difference whether the code is interpreted or jitted, since the cost of computing the result dominates the cost. This is what I believe Rosetta 2 is doing on the M1 and M2. When I micro-benchmark x87 floating point operations, specifically things like square roots, it takes on the order of 600 cycles to emulate under Rosetta. That's about the same cost as implementing a pure software floating point function like I do in xtabase where the clock cycle cost is similar. This suggests that Rosetta is likely dispatching the x87 operations to compiled C code or possibly a static library written in assembly and may in fact use a JIT-interpreter hybrid model. Regardless, kudos to Apple for dead-on accurate x87 emulation.
There is a great opportunity for a third parties who work on projects such as QEMU or FEX or heck even Apple to keep experimenting with clever interpreter + JIT + AOT combinations in this new era of ARM64 devices. I think I've said this before, but playing around with ARM64 reminds me a lot of the old days of 6502 and 68000 when everybody was basically a hobbyist programmer and learning clever tricks.
Now, much in the same way that a flashing strobe light can appear to freeze rotating objects, we can use a similar technique to "freeze" the execution of a translated code loop to make it more discoverable in the debugger. Assuming you've installed the Windows Debugger as per my previous directions, let's start poking around the translation cache!
I am going to comment out the FlushInstrutionCache() calls for this, and increase the number of rounds of the test from 10 to 1 million (to effectively put the test into a near infinite loop). We don't want to explicitly code up an infinitely loop because a clever translator could choose to optimize away code. So we just run the existing loop for many more iterations. We do this both in the test harness (by increasing the number of rounds) but we can also inject additional looping into the x64 test code.
Attaching the WinDbg debugger to our original test case, we know that most of the 187 cycles per iteration are spent in EC bitmap lookup code or transition code, and only a few cycles will be spent in the translation. So the odds of "strobing" on translated code are low. I can demonstrate this by attaching the debugger at a random, dumping the registers, and seeing what some of the point to.
In this sample, two of the registers, X3 and X22 point to addresses that match the addresses of the allocated JIT blocks, so I know that I can disassemble both (one as ARM64 and the other as AMD64) and voila, the test code that was freshly generated. You can see X3 points at the generated ARM64 code and X22 at the generated x64 code:
0:000:ARM64EC> u
va2+0x1948c:
00007ff7`f5a5948c aa0803e0 mov x0,x8
00007ff7`f5a59490 910083ff add sp,sp,#0x20
00007ff7`f5a59494 a8c17bfd ldp fp,lr,[sp],#0x10
00007ff7`f5a59498 d50323ff autibsp
00007ff7`f5a5949c d65f03c0 ret
00007ff7`f5a594a0 d503237f pacibsp
00007ff7`f5a594a4 a9bf7bfd stp fp,lr,[sp,#-0x10]!
00007ff7`f5a594a8 910003fd mov fp,sp
0:000:ARM64EC> r
x0=0000000000212998 x1=0000000000000000 x2=0000000000000000 x3=00000158a7110000
x4=0000000000000004 x5=0000000000000000 x6=0000000000000000 x7=0000000000000000
x8=0000000000212999 x9=0000000000212999 x10=0000000000000000 x11=0000000000000000
x12=0000000000000000 x13=0000000000000000 x14=0000000000000000 x15=0000000000000000
x16=0000000000000000 x17=0000000000000000 x18=0000000000000000 x19=00000000000c9d28
x20=00007ff7f5a59000 x21=00007ff8fe5a94a8 x22=00000158a7190000 x23=0000000000000000
x24=0000000000000000 x25=00000000000022b2 x26=00000000131b6236 x27=00000000002dc6c0
x28=0000000000000000 fp=00000003f1affdd0 lr=0000000000000000 sp=00000003f1affdb0
pc=00007ff7f5a5948c psr=00000040 ---- EL0
0:000:ARM64EC> u 000158a7110000
00000158`a7110000 11000400 add w0,w0,#1
00000158`a7110004 d65f03c0 ret
00000158`a7110008 00000000 ???
00000158`a711000c 00000000 ???
00000158`a7110010 00000000 ???
00000158`a7110014 00000000 ???
00000158`a7110018 00000000 ???
00000158`a711001c 00000000 ???
0:000:ARM64EC> .effmach amd64
Effective machine: AMD64 (CHPEv2) (AMD64)
0:000:AMD64> u 000158a7190000
00000158`a7190000 8bc1 mov eax,ecx
00000158`a7190002 83c001 add eax,1
00000158`a7190005 c3 ret
We can rule out registers that have an odd address since those by definition are not 4-byte aligned native ARM64 instruction addresses. And anything that starts with address 7FF something is generally a loaded system DLL. This is a nice sanity check that the correct code got gnerated, but not a terribly useful technique per se.
So let's inject an additional x64 instruction to force a long loop inside the x64 test code:
0:000:AMD64> u 00249`a8010000
00000249`a8010000 8bc1 mov eax,ecx
00000249`a8010002 83c001 add eax,1
00000249`a8010005 71fb jno 00000249`a8010002
00000249`a8010007 c3 ret
That's better! I chose to loop on a "jump no overflow" instruction because a simple "jump not equal" is easier for a translator to optimize away (by realizing that the exit condition of the loop is EAX=0) whereas realizing that JNO generates creates an EAX=0x80000000 exit condition is trickier to catch. Pro tip: always assume the emulator is smarter than it really is, just in case.
Use the debugger's !address command to dump out allocated regions of address space inside a process. Filtering by only regions that have EXECUTE permission shows something interesting:
C:\Debuggers> echo !address ; q | cdb -pv -pn va2.exe | findstr EXECUTE
+ 1fb`01330000 1fb`01331000 0`00001000 MEM_PRIVATE MEM_COMMIT PAGE_EXECUTE_READ <unknown> [................]
1fb`017e0000 1fb`018e0000 0`00100000 MEM_PRIVATE MEM_COMMIT PAGE_EXECUTE_READWRITE <unknown> [.9.........y....]
+ 1fb`05ce0000 1fb`05d05000 0`00025000 MEM_MAPPED MEM_COMMIT PAGE_EXECUTE_READ MappedFile "\Device\HarddiskVolume3\Windows\XtaCache\KERNEL32.DLL.D80B4...
+ 1fb`05d10000 1fb`05d34000 0`00024000 MEM_MAPPED MEM_COMMIT PAGE_EXECUTE_READ MappedFile "\Device\HarddiskVolume3\Windows\XtaCache\KERNELBASE.DLL.591...
+ 1fb`05e50000 1fb`05ed0000 0`00080000 MEM_PRIVATE MEM_COMMIT PAGE_EXECUTE_READWRITE <unknown> [................]
+ 1fb`05ed0000 1fb`05f50000 0`00080000 MEM_PRIVATE MEM_COMMIT PAGE_EXECUTE_READWRITE <unknown> [.....q..........]
+ 1fb`05f50000 1fb`05fd0000 0`00080000 MEM_PRIVATE MEM_COMMIT PAGE_EXECUTE_READWRITE <unknown> [xV4.............]
7ff6`27451000 7ff6`2746c000 0`0001b000 MEM_IMAGE MEM_COMMIT PAGE_EXECUTE_READ Image [va2; "A:\arm-boot-camp\va2\va2.exe"]
7ff8`f9431000 7ff8`f94d5000 0`000a4000 MEM_IMAGE MEM_COMMIT PAGE_EXECUTE_READ Image [apphelp; "C:\windows\SYSTEM32\apphelp.dll"]
7ff8`f9e21000 7ff8`fa0a3000 0`00282000 MEM_IMAGE MEM_COMMIT PAGE_EXECUTE_READ Image [KERNELBASE; "C:\windows\System32\KERNELBASE.dll"]
7ff8`fde11000 7ff8`fdf03000 0`000f2000 MEM_IMAGE MEM_COMMIT PAGE_EXECUTE_READ Image [KERNEL32; "C:\windows\System32\KERNEL32.DLL"]
7ff8`fdfc1000 7ff8`fe066000 0`000a5000 MEM_IMAGE MEM_COMMIT PAGE_EXECUTE_READ Image [xtajit64; "C:\windows\System32\xtajit64.dll"]
7ff8`fe441000 7ff8`fe6fb000 0`002ba000 MEM_IMAGE MEM_COMMIT PAGE_EXECUTE_READ Image [ntdll; "C:\windows\SYSTEM32\ntdll.dll"]
All of the mapped DLLs such as NTDLL, the xtajit64.dll translator, KERNEL32, and the test binary itself (va2.exe) show up as expected, as do the pre-translated cached translations for KERNEL32.DLL and KERNELBASE.DLL. I haven't mentioned it much but besides ARM64EC, JIT, and interpretation there is fourth mode of emulation of using offline-translated ARM64 code. This is performed by a service called XtaCache and is what generates those cached translation files (the "Jit Cache" .JC files) in the C:\Windows\XtaCache directory. The emulation plumbing checks for the existence of a .JC for every binary in case it have previously been emulated under JIT.
XtaCache is a post-JIT translator, as opposed to an ahead-of-time translator. What that means is that a .JC file only comes into existence after a foreign binary has been run at least once _and_ emulation was invoked on at least one block of code in that binary.
XtaCache can only work on static code backed by an on-disk .EXE or .DLL binary. XtaCache cannot translate dynamically generated bytecode as generated by say Javascript or our hybrid JIT example here.
You can disable XtaCache by typing "net stop xtacache" at an elevated command prompt. You can also flush its translation at that point by typing "del /s /q C:\Windows\XtaCache" and then typing "net start xtacache" to start generating new offline translation all over again.
There is not much else to say about XtaCache, especially since it does not get involved here in our JIT-on-JIT test case, other than to say experiment with it and see if you measure any difference between a JIT-only scenario and a JIT+XtaCache scenario. Pro tip: run any executable at least 3 times before benchmarking it when XtaCache is enabled. The first run is by design JIT-only. The second run will use some cached code, but you want to make sure the app wasn't running some first-time initialization. So by running a second time the test app should skip any first-run initialization code paths. And then just to be sure run it a third time to make sure that the cached translations have hit a steady state.
Back to our address range dump, if we eliminate all address ranges that are either mapped files, too small, or the known allocations by the test program, a single block is left at address 1FB017E0000 of size 1 megabyte and it is writeable. We've found the JIT compiler's live translation cache!
You can see how automatable this is. Using a technique called non-invasive debugging as well as using the CDB command line debugger instead of the usual GUI based WinDbg is sufficient for the purposes of "strobing" the test app, we don't need the full debugger GUI or other tools. What non-invasive mode allows us to do is to peek insider of a running process without disturbing it. See, if you attach a debugging normally, the process is interrupted as a thread is injected to trigger a breakpoint. Not only does that perturb the process it also changes the flow control and alerts the emulator that something is up. If you attach non-invasively the code runs undisturbed.
Notice the command line options used above to dump address ranges:
-pv is the non-invasive option
-pn va2.exe means attach to a process called va2.exe. This works when you only have one instance of unique test binary running and saves the effort of looking up the PID (process ID) each run.
I used the echo command to pipe commands to the debugger to partially script the operation (which allows for a faster "strobe" rate). Using the command line debugger permits piping the output, as in this case to findstr to filter the memory blocks. Output can also be piped to a file.
Given the known start address 1fb`017e0000 of the JIT cache we can now dump that entire memory region and look for the most recently translated code by seeing where code ends and only zeroes follow. Et voila, the most recently translated block is in fact the translated ADD JNO RET test loop:
000001fb`017ef464 aa18f3ce orr x14,lr,x24,lsl #0x3C
000001fb`017ef468 31000718 adds w24,w24,#1
000001fb`017ef46c d500401f cfinv
000001fb`017ef470 aa1803ed mov x13,x24
000001fb`017ef474 91000d30 add xip0,x9,#3
000001fb`017ef478 529f6e2f mov w15,#0xFB71
000001fb`017ef47c 97fffb4a bl 000001fb`017ee1a4
000001fb`017ef480 54fffe67 bvc 000001fb`017ef44c
000001fb`017ef484 91001530 add xip0,x9,#5
000001fb`017ef488 5280186f mov w15,#0xC3
000001fb`017ef48c 97fffb41 bl 000001fb`017ee190
000001fb`017ef490 f8408789 ldr x9,[x28],#8
000001fb`017ef494 97fffefd bl 000001fb`017ef088
000001fb`017ef498 d61f0220 br xip1
000001fb`017ef49c 17ffff6f b 000001fb`017ef258
000001fb`017ef4a0 d43579a0 brk #0xABCD
000001fb`017ef4a4 05ed0002 ???
000001fb`017ef4a8 000001fb ???
000001fb`017ef4ac 0144a0c3 ???
000001fb`017ef4b0 000a00c4 ???
000001fb`017ef4b4 000080c0 ???
000001fb`017ef4b8 00000000 ???
000001fb`017ef4bc 00000000 ???
000001fb`017ef4c0 00000000 ???
000001fb`017ef4c4 00000000 ???
000001fb`017ef4c8 00000000 ???
000001fb`017ef4cc 00000000 ???
000001fb`017ef4d0 00000000 ???
000001fb`017ef4d4 00000000 ???
000001fb`017ef4d8 00000000 ???
000001fb`017ef4dc 00000000 ???
The rest of the memory block is all zeroes so we can be certain this is in fact the last translated block. You can script this further so that the entire "strobing" of the test app and discovering the translated block takes under 10 seconds. Neither the emulator nor the debugger really prevent you from discovering the translations (it's much simpler than what I see people needing to do with Rosetta for example).
Let's look at the actual translated instructions above, let's break it up into pieces and analyze each one:
000001fb`017ef464 aa18f3ce orr x14,lr,x24,lsl #0x3C
000001fb`017ef468 31000718 adds w24,w24,#1
000001fb`017ef46c d500401f cfinv
000001fb`017ef470 aa1803ed mov x13,x24
This is the translated ADD EAX,#1 instruction. You can therefore determine that in the context of translated code the same register mapping as ARM64EC is _not_ being used. EAX/RAX in this case is mapped to W24/X24. You can also see that register X13 and X14 - which are unmapped in ARM64EC state - are in fact used freely. The ADDS opcode is the flag-setting version of the ARM64 ADD instruction, so this tells us that the NZVC flags are being generated. The CFINV flips the Carry flag. This is because ARM64 (just like PowerPC, ARM32, 6502, and RISC architectures) flip the meaning of the Carry flag compared to say x86 or 68040. The Carry flag is generated opposite of what x86 does for subtract operations, and because compares and subtracts are much more frequent in x86/x64 than additions, the JIT inverts the Carry flag state so after addition and leaves it as-is after subtraction. This means that the live Carry flag in ARM64 state represents the exact opposite of what it does in x86 or x64 state. The inverted state of Carry is documented and baked in to the ARM64EC spec:
The NZVC flags are considered live and mapped directly between the emulated x64 state and the ARM64 flags register. Parity Flag and Adjust Flag are not mapped in ARM64EC state (as they are inaccessible to compiled C/C++ code anyway) but they _are_ maintained in the JIT state, as per the updates of X14 (Adjust register) and X13 (Parity register).
Next, because I failed to follow my own advice and did not call VirtualProtect() to write-protected the x64 code I generated, the translator has to be conservative and checksum any translated code that was EXECUTE_READWRITE. To maximize emulation performance, x64 dynamic code generators should write-protect freshly generated code as soon as possible.
000001fb`017ef474 91000d30 add xip0,x9,#3
00001fb`017ef478 529f6e2f mov w15,#0xFB71
000001fb`017ef47c 97fffb4a bl 000001fb`017ee1a4
Next comes the translated JNO (jump if no overlow), which in ARM64 parlance is called BVC (branch if overflow clear):
000001fb`017ef480 54fffe67 bvc 000001fb`017ef44c
that is followed by another checksum of the next instruction, the RET:
000001fb`017ef484 91001530 add xip0,x9,#5
000001fb`017ef488 5280186f mov w15,#0xC3
000001fb`017ef48c 97fffb41 bl 000001fb`017ee190
which is the followed by the translated RET instruction:
000001fb`017ef490 f8408789 ldr x9,[x28],#8
000001fb`017ef494 97fffefd bl 000001fb`017ef088
000001fb`017ef498 d61f0220 br xip1
The LDR is a post-incrementing form of memory load which is used to pop the x64 return address and adjust the x64 stack pointer. This indicates that X28 is mapped as the x64 RSP Stack Pointer register (separate from the host ARM64 Stack Pointer register which is in use by the emulator itself).
We can deduce from the checksum setup for the RET instruction that the checksum truly is a checksum - note the expected checksum value of C3 loaded into W15, the exact value of the single-byte RET opcode (C3). One has to wonder why the JIT does not simply perform a one-byte load and compare instead of making a function call to checksum one single byte. Optimization opportunity!
We can also deduce by the use of the X9 register in the checksum sequences as well as the RET sequence that X9 holds the x64 RIP (the instruction pointer / program counter). Notice that X9 is not updated after every emulated instruction, but remains fixed within a block, holding the starting address of the translated block. That is why the checksum code uses ADD X16,X9,#nn instructions, the #nn constant is the x64 byte offset into the block and is added to the fixed X9 to compute the address being checksummed.
The loaded X9 is then passed to a function call (the BL) which returns with a value in xip1 (another name for X17) and performs an indirect jump. This is similar to the "check and jump" code sequence for EC Bitmap lookups, except in this case the call performs a table-lookup to find the translation for the return address. You can verify this by seeing that the target of that BL instruction is in fact a "shift-and-mask" hash table lookup of a key-value pair. The UBFX instruction is a bitfield extract of program counter address bits to compute the hash index, and we can see that the hash table itself is stack based (being addressed via an offset from the native ARM64 stack pointer):
000001fb`017ef088 912443ef add x15,sp,#0x910
000001fb`017ef08c d3413530 ubfx xip0,x9,#1,#0xD
000001fb`017ef090 8b1011ef add x15,x15,xip0,lsl #4
000001fb`017ef094 a8c145f0 ldp xip0,xip1,[x15],#0x10
000001fb`017ef098 cb090210 sub xip0,xip0,x9
000001fb`017ef09c b5000990 cbnz xip0,000001fb`017ef1cc
000001fb`017ef0a0 d65f03c0 ret
Let's now fix the page protection on the x64 JIT buffer so that the translator does not have to emit checksums:
VirtualProtect(X64Code, 4096, PAGE_EXECUTE_READ, &OldProtect);
that's better, no checksums in the translation any more:
000001fc`b43df400 aa18f3ce orr x14,lr,x24,lsl #0x3C
000001fc`b43df404 31000718 adds w24,w24,#1
000001fc`b43df408 d500401f cfinv
000001fc`b43df40c aa1803ed mov x13,x24
000001fc`b43df410 54ffff47 bvc 000001fc`b43df3f8
000001fc`b43df414 f8408789 ldr x9,[x28],#8
000001fc`b43df418 97ffff1c bl 000001fc`b43df088
000001fc`b43df41c d61f0220 br xip1
It is easy to test a few variants: use a subtract instead of an add, and what about smaller data sizes? ARM64 has no such concept as a 16-bit addition or 8-bit addition the way x86 does, how is that translated?
As I make changes to the x64 test code, I can speed up debugging by having the test binary itself print out not just the addresses of the relevant buffers, but also emit the exact debugger commands that I will need. This way I can just copy/paste the screen output into another command window to invoke the debugger, like this (including the write-protect change):
printf(" echo !address; q | cdb -pv -pn va2.exe | findstr EXECUTE_READWRITE\n");
printf(" echo .effmach amd64 ; u %p ; q | cdb -pv -pn va2.exe\n", X64Code);
printf(" cdb -pv -pn va2.exe\n", X64Code);
// Write-protect and flush the x64 JIT buffer
DWORD OldProtect = 0;
VirtualProtect(X64Code, 4096, PAGE_EXECUTE_READ, &OldProtect);
FlushInstructionCache(GetCurrentProcess(), X64Code, 4096);
The test binary nicely outputs the specific commands to locate the JIT cache in memory as well as disassemble the test x64 code sequence:
echo !address; q | cdb -pv -pn va2.exe | findstr EXECUTE_READWRITE
echo .effmach amd64 ; u 000001A77C570000 ; q | cdb -pv -pn va2.exe
cdb -pv -pn va2.exe
C:\Debuggers> echo !address; q | cdb -pv -pn va2.exe | findstr EXECUTE_READWRITE
1e0`bba30000 1e0`bbb30000 0`00100000 MEM_PRIVATE MEM_COMMIT PAGE_EXECUTE_READWRITE <unknown> [.9.........y....]
C:\Debuggers> echo .effmach amd64 ; u 000001A77C570000 ; q | cdb -pv -pn va2.exe
0:000> Effective machine: AMD64 (CHPEv2) (AMD64)
000001e0`c0160000 8bc1 mov eax,ecx
000001e0`c0160002 83c001 add eax,1
000001e0`c0160005 71fb jno 000001e0`c0160002
000001e0`c0160007 c3 ret
With not too much work I can pretty much automate this to where I'm able to add and test a new x64 instruction in under one minute total round trip time. Food for thought: One could in theory automate this further to programmatically generate thousands of valid Intel x64 test instruction variants and capture the translations automatically and store them to disk.
I did a semi-automated implemention to generate variants of ADD/SUB/INC/DEC on various register sizes. Just focusing on the one instruction that was being modified and each corresponding translation produces this:
000002b9`3e550002 6683c001 add ax,1
000002b9`39e4f408 aa18f3ce orr x14,lr,x24,lsl #0x3C
000002b9`39e4f40c b25003ed movi x13,#0x1000000000000
000002b9`39e4f410 ab18c1ad adds x13,x13,x24,lsl #0x30
000002b9`39e4f414 b370fdb8 bfxil x24,x13,#0x30,#0x10
000002b9`39e4f418 d500401f cfinv
000002b9`39e4f41c d370fdad lsr x13,x13,#0x30
000001ed`68c40002 66ffc0 inc ax
000001ed`645df40c aa18f3ce orr x14,lr,x24,lsl #0x3C
000001ed`645df410 da9f33e7 csetmhs x7
000001ed`645df414 b25003ed movi x13,#0x1000000000000
000001ed`645df418 ab18c1ad adds x13,x13,x24,lsl #0x30
000001ed`645df41c ba1f84e2 rmif x7,#0x3F,#2
000001ed`645df420 b370fdb8 bfxil x24,x13,#0x30,#0x10
000001ed`645df424 d370fdad lsr x13,x13,#0x30
000001a4`1c0e0002 83e801 sub eax,1
000001a4`179df3fc d3440f0e lsl x14,x24,#0x3C
000001a4`179df400 71000718 subs w24,w24,#1
000001a4`179df404 aa1803ed mov x13,x24
000001c4`540b0002 6683e801 sub ax,1
000001c4`4fa4f408 d3440f0e lsl x14,x24,#0x3C
000001c4`4fa4f40c d3503f0d lsl x13,x24,#0x30
000001c4`4fa4f410 b25003ec movi x12,#0x1000000000000
000001c4`4fa4f414 eb0c01ad subs x13,x13,x12
000001c4`4fa4f418 b370fdb8 bfxil x24,x13,#0x30,#0x10
000001c4`4fa4f41c d370fdad lsr x13,x13,#0x30
000002dd`849c0002 66ffc8 dec ax
000002dd`8030f40c d3440f0e lsl x14,x24,#0x3C
000002dd`8030f410 da9f33e7 csetmhs x7
000002dd`8030f414 b2503fed movi x13,#-0x1000000000000
000002dd`8030f418 ab18c1ad adds x13,x13,x24,lsl #0x30
000002dd`8030f41c ba1f84e2 rmif x7,#0x3F,#2
000002dd`8030f420 b370fdb8 bfxil x24,x13,#0x30,#0x10
000002dd`8030f424 d370fdad lsr x13,x13,#0x30
So there you go folks, very straightforward and _very_ unoptimized. A single ALU register operation that in x86/x64 is a 1-cycle 3- or 4-byte instruction can translate to as much as 7 ARM64 instructions!!
I've placed the source code of this VirtualAlloc2() and hybrid JIT demonstration into this GitHub directory: https://github.com/softmac/cpuidex/tree/main/VirtalAlloc2
Just from this trivial exercise you can deduce a lot about the XTA code translation:
- emulating ADD is more expensive than emulating SUB due to Carry flag flipping on the ADD
- emulating INC and DEC is more expensive than emulating ADD and SUB due to Carry flag preservation (the "partial flags" issue that once affected real Intel hardware)
- emulating partial-register ALU operations also incurs additional overhead due to shifts to move the data to the highest bits of the register and bitfield inserts
- X9 -> RIP, X28 -> RSP, X24 -> RAX, X13 -> lazy Parity flag state, X14 ->lazy Adjust flag state, X15 X16(xip0) and X15(xip1) are scratch registers
- block-to-block indirect flow control is done via an outlined hash table lookup and requires a minimum of 9 ARM64 instructions
- JIT-on-JIT is very costly and could be alleviated with a hybrid JIT-interpreter approach
- translating writeable code pages adds additional overhead
- writeable code pages are also not offline translated by xtacache
I leave it now to you the reader to go experiment by writing additional x64 code samples and feeding them through xtajit64 to deduce the remainder of the register mappings and see what the translations look like. This is trivial due to the "boilerplate translator" which tends to emit the same translated code for the same input code (think C compiler compiling with -Od optimization flag).
As you explore on your own and look at larger translations, you will see that there really is no optimizing compiler behind the curtain that's performing instruction re-ordering, constant propagation, or dynamic register allocation. This is a great opportunity for experimentation given the relatively large register file of ARM64 compared to traditional x86 and x64 to wild trying all sorts of experiments.
Is there a better way to emulate Carry flag than by keeping it live? INC and DEC would seem to suggest so, since they spill the live Carry flag to a temp register. Suggestion: Why not always keep x64 Carry flag state lazy in a register, similar to how Parity and Adjust are handled? This would optimize the code generation for INC and DEC and would eliminate the need for the CFINV Carry flag flipping, making ADD and SUB take equal number of instructions (and clock cycles).
Is there a better way to emulate partial register operations than by shifting them up the highest lane of a register? Suggestion: ARM64 has these nice instructions called SETF8 and SETF16 which update flags for 8-bit and 16-bit results without the need for shifting. And they don't modify the Carry flag (only the NZV flags) which makes this proposal compatible with the lazy Carry flag proposal.
Intel and AMD hardware performance is! I just want to end this tutorial (and congratulations if you read the whole thing) to say that too many people seem obsessed with comparing the performance of emulation between XTA and Rosetta. In my opinion that is the wrong comparison to worry about. Apple stopped manufacturing Intel-based Macs almost 5 years ago. They're not competing with anything newer and their emulation for the most part already beats that old Intel performance. So they really have little motivation to improve Rosetta's performance or catch up to the latest AVX extensions. Microsoft on the other hand _does_ have to compete against latest-and-greatest, especially if it plans to keep branding its Intel and ARM64 devices with the same name (as in the Surface Pro 9 case). You can't have one device supporting AVX2 and the other not and give them the exact same product name. The software emulation has to match the comparable hardware.
Beware of red herrings that look good on paper.
For example, people who have studied Rosetta have documented some additional optimization tricks that Rosetta takes advantage of, such as that the Adjust and Parity flags are generated by the M1/M2 hardware itself. These flags are rarely accessed or used and the cost of the extra shift and move are minimal since they don't themselves have any data dependencies (i.e. they are "dead stores").
Another common misconception about Rosetta is that it is fast because the hardware enforces Intel memory ordering, something called Total Store Ordering. I will make the argument that TSO is the last thing you want, since I know from experience the emulator has to access its own private memory and none of those memory accesses needs to be ordered. In my opinion, TSO is ar red herring that isn't really improving performance, but it sounds nice on paper.
What Rosetta does better is that it implements has a "leaf function" optimization where that hash table lookup on the RET is eliminated and the translation simply returns to the calling translation. Such an optimization clearly does not happen on XTA even with a simple 4-instruction leaf function. More optimization opportunity!
People also seem to be focused on comparing emulated performance vs. native performance on the same device (e.g. Rosetta emulation vs. native ARM64 on a Macbook). That too in my opinion is the wrong way to look at it. Dynamic binary translation is capable of outperforming static natively compiled code (see my blog posts on dynamic optimization back from 2015). So native ARM64 performance != speed of light, you can go faster than what a C++ compiler generates natively. Again, I will argue that the performance against competing AMD and Intel devices should be the true goal post to shoot for. The emulators out there today are just scratching the surface of what's possible in code translation.
These are exciting times and I am hoping that 2024 brings new breakthrough in binary translation and ARM64 hardware performance. Thank you reading the ARM64 Boot Camp! Nothing more I can teach you.
[ARM64 Boot Camp: Table Of Contents] [Return to Emulators.com]